What Is a Pullback?
A pullback is a short-term, counter-trend correction within an established uptrend or downtrend — usually a temporary dip or bounce inside the trend, not a reversal.
Used well, pullbacks improve the win rate of trend-following strategies and reduce the risk of chasing extremes. This article covers the core concept of a pullback, how to identify it, and how to use it — a practical guide to finding more reasonable entry timing in the market.
- Definition: a brief counter-trend correction, not a reversal
- Core use: buy dips in uptrends, sell rallies in downtrends
- Toolkit: trendlines, MAs, Bollinger Bands, S/R, RSI/MACD
- Risk control: stop where the trend breaks; trail to take profit
- Avoid traps: confirm with indicators, volume, and candles
1. What Is a Pullback, and Why Watch for It?
A pullback is the short-term, counter-trend price move that appears inside a clear uptrend or downtrend. The pullback itself is usually a temporary phenomenon and does not signal the end of the prevailing trend.
Put simply:
- In an uptrend, a pullback is a temporary dip in price.
- In a downtrend, a pullback (often called a "bounce" or "rally") is a temporary lift in price.
Pullbacks are sometimes referred to as "corrections" or "corrective waves", and many participants in equity and futures markets deliberately wait for them as low-risk entry opportunities.
Why Pullbacks Matter
In an uptrend, a pullback is regarded as a "buy-the-dip" opportunity: by entering at a relatively cheaper level after the price has pulled back, traders can secure a better risk/reward profile when the trend resumes.
2. Telling a Pullback From a Reversal
The critical skill in pullback trading is understanding pullback entry and sell-the-rally setups and correctly judging whether the market is in a pullback or is actually beginning a reversal. This judgment is the core of avoiding the wrong entry.
2.1: What Is a Pullback Entry?
When the market is in an uptrend, prices occasionally pull back briefly. These short-term dips are the pullback, and entering long inside them is what traders call a pullback entry or "buying the dip".
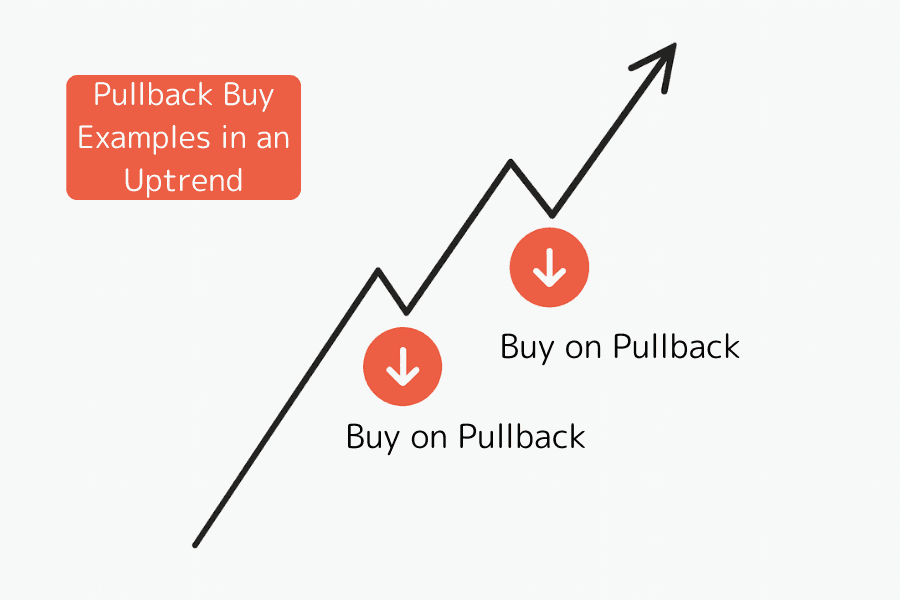
Typical features of a pullback entry:
- Often appears around support zones, the moving average, trendline, or the lower Bollinger Band.
- These levels are seen as places where the price is likely to stop falling and rejoin the uptrend.
- The intent is to enter long ahead of the resumption of the original uptrend after the pullback ends.
Watch for misreads
A pullback can sometimes turn out to be the early stage of a reversal. Pair it with technical indicators such as RSI and MACD and with volume confirmation, and set the stop carefully to keep risk under control.
2.2: What Is Selling the Rally?
When the market is in a downtrend, prices occasionally bounce briefly. These short-term lifts are the bounce, and entering short inside them is what traders call selling the rally.
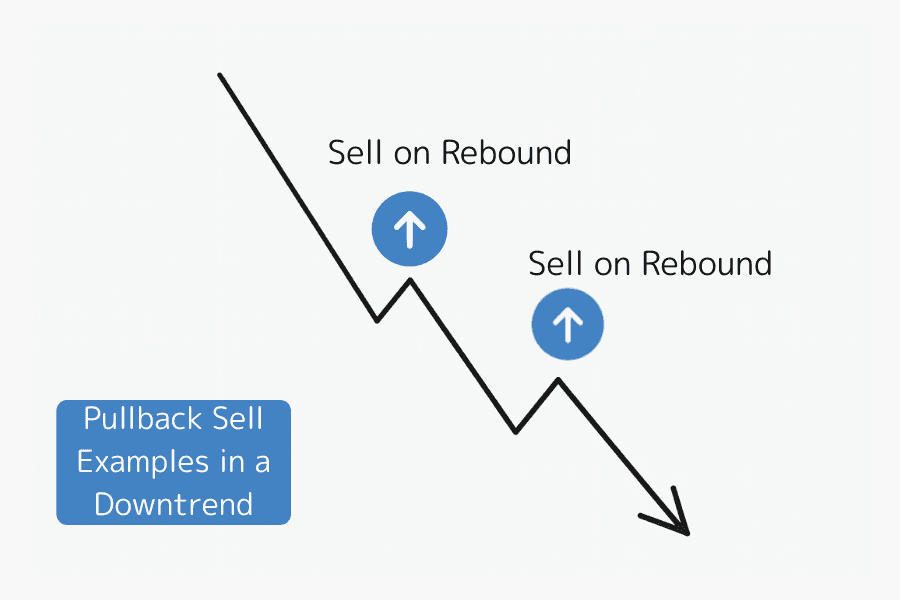
Typical features of selling the rally:
- Often appears around resistance zones, the moving average, trendline, or the upper Bollinger Band.
- These levels are seen as places where the price is likely to stop rising and rejoin the downtrend.
- The intent is to enter short ahead of the resumption of the original downtrend after the bounce ends.
Watch for misreads
A bounce can sometimes turn out to be the early stage of a reversal. Combine indicator confirmation with strict stop placement to avoid serious losses.
3. Buying Pullbacks: Worked Examples
With the basics in mind, let's look at typical pullback entries on real charts to make the timing more intuitive.
Example 1: Pullback Entry on a Trendline
The chart below is a 15-minute XAU/USD (gold-dollar) chart with an uptrend line drawn in.
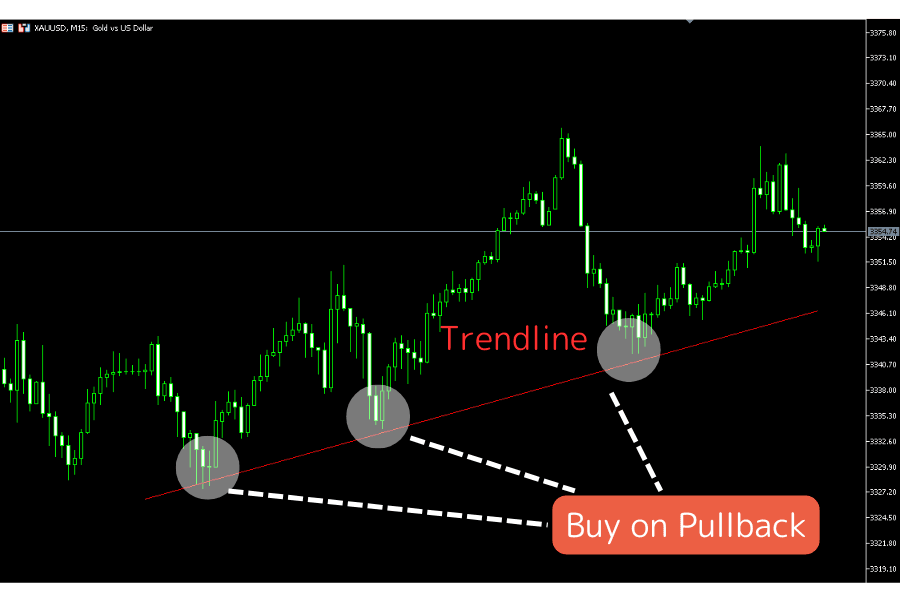
The chart shows price repeatedly pulling back to the trendline, finding support, bouncing, and continuing the uptrend. Every time the price gets close to the trendline, it becomes a potential pullback-entry candidate.
This is a classic example of using a trendline as the entry framework — when the trendline holds, pullback-entry opportunities tend to appear cleanly.
Example 2: Pullback Entry on a Moving Average
The chart below is a 5-minute EUR/USD chart with a moving average (MA) overlaid.
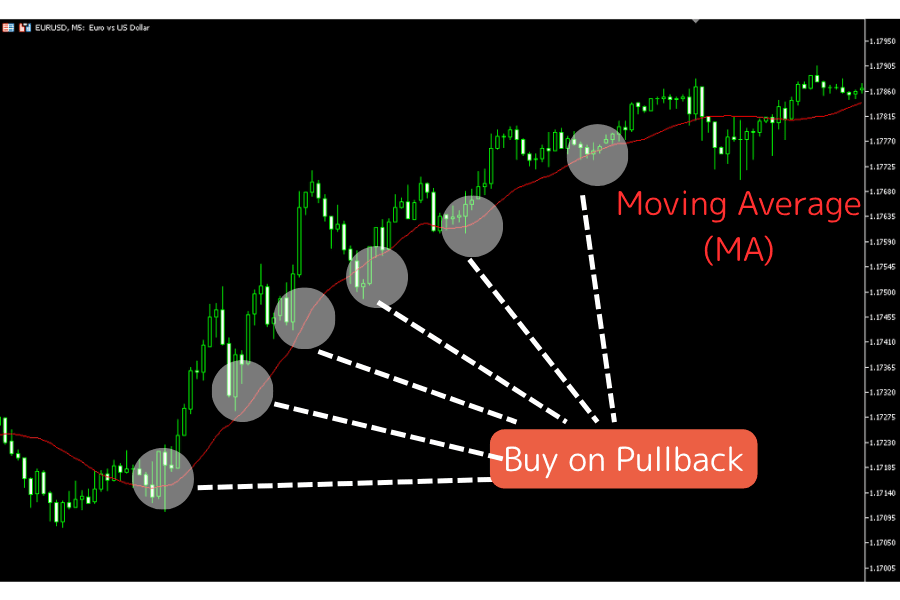
The chart shows price maintaining an uptrend overall and pulling back to the moving average multiple times before resuming higher. These pullbacks toward the MA are typical pullback-entry windows.
This is a classic example of using the MA as the reference axis — when price ranges around the MA on the way up, pullbacks to the MA can be treated as candidate long entries.
4. Frequently Asked Questions
Q1. Where should the stop be on a pullback entry?
Place it below the trendline, below the moving average, or below the recent swing low. The stop should sit where the trend would actually be invalidated, leaving the trade reasonable room to breathe.
Q2. What tools should support a pullback-entry decision?
Combine volume, candle patterns (long lower shadows, engulfing setups), and technical indicators (RSI, MACD) to confirm that support is genuinely holding — instead of relying on the trendline or the MA alone.
Q3. When the trend is obvious, do we still need to wait for a pullback?
Yes. Even with a strong trend, waiting for a pullback usually offers a lower-risk and higher-reward entry. Chasing price into a strong move tends to get shaken out by short-term volatility.
Q4. What to do when the read is wrong?
If the stop is triggered, exit decisively. Avoid adding to the loser, averaging down, or moving the stop further away. The stop is the single most important tool for protecting capital.
Q5. Where should the take-profit go?
Around the prior swing high (for a pullback entry) or the prior swing low (for selling the rally). Combining a trailing stop with these levels lets you lock in profit progressively as the trend extends.
Q6. What mindset matters for pullback trading?
Patience matters. The pullback does not always reach the "perfect" level, and sometimes the right call is to let the opportunity pass instead of forcing an entry.
Q7. What's the difference between a pullback and a drawdown?
In everyday trading speak the two are often treated as the same — both are "temporary corrections" within a trend. More precisely, however, a Pullback is a short-term counter-move within a trend, emphasising entry timing and used in technical analysis. A Drawdown is the decline in account equity from peak to trough, a portfolio-management and performance-statistics concept. Pullbacks describe price behaviour; drawdowns describe equity behaviour. The two concepts are related but distinct, even if commonly used interchangeably.
5. Summary
Pullback trading is a relatively safe, higher-win-rate trend-following entry technique. Whether using a trendline or a moving average, the core principle is patience: wait for price to retrace to a reasonable level, confirm support or resistance, and then enter.
Combining the pullback-entry / sell-the-rally framework with disciplined stops and take-profits provides a stable foundation for compounding gains in the market. The most important thing is to stay disciplined, respect the market, avoid chasing, and avoid counter-trend trades — that consistency is what makes long-run trading possible.
Further Reading
- What Is a Moving Average (MA)?
- What Are Bollinger Bands?
- What Is RSI?
- What Is MACD?
- What Is a Stop Loss?
- What Is Trend Following?
- Forex Trading Basics
Titan FX Research. Investor-education content covering forex (FX), commodities (oil, precious metals, agricultural products), stock indices, US equities, and crypto assets across global markets.
Primary Sources by Category
- Technical analysis theory: Edwards, R. D. & Magee, J. (2018) Technical Analysis of Stock Trends, 11th ed.; Murphy, J. J. (1999) Technical Analysis of the Financial Markets; Pring, M. J. (2014) Technical Analysis Explained, 5th ed.
- Trend and pullback research: Bulkowski, T. N. Encyclopedia of Chart Patterns on short-term retracement patterns; Tushar S. Chande, The New Technical Trader on trendline-pullback setups
- Moving averages: J. Welles Wilder Jr., New Concepts in Technical Trading Systems on MA-based methodology; Granville, J. (1976) Granville's New Strategy of Daily Stock Market Timing for Maximum Profit
- Risk management and behavioural finance: Van K. Tharp, Trade Your Way to Financial Freedom on stop-loss and take-profit methodology; Daniel Kahneman, Thinking, Fast and Slow on trading psychology