

Supply and Demand Zones: How to Draw Them, Four Patterns and Trading Strategy
Demand zones below the current price tend to act as support, and supply zones above it tend to act as resistance. Traders look for entries near these zones and place their stops just outside them.
This guide covers what supply and demand zones are, how they differ from support and resistance, the four common patterns, how to draw them, how to judge their strength, how to trade them, and how to see where orders cluster with a Titan FX tool.
- A supply and demand zone is where price paused and then left sharply; demand zones sit below price and supply zones sit above it
- The moves before and after the pause define four patterns: continuation (RBR, DBD) and reversal (DBR, RBD)
- To draw a zone, find the large candles that left the area, then mark the pause before them with a proximal line and a distal line
- Zones that price left quickly, after a short pause, that have not been retested and that broke market structure tend to deserve the most attention
- A common approach is to enter near the proximal line, place the stop beyond the distal line, and target the next opposing zone
- 1. What Are Supply and Demand Zones?
- 2. Supply and Demand Zones vs. Support and Resistance
- 3. The Four Supply and Demand Patterns
- 4. How to Draw Supply and Demand Zones
- 5. How to Judge the Strength of a Zone
- 6. How to Trade Supply and Demand Zones
- 7. Spotting Order Clusters with a Titan FX Tool
- 8. Limitations and Risks
- 9. FAQ
- 10. Conclusion
1. What Are Supply and Demand Zones?
A supply and demand zone is a price range with an upper and a lower boundary. Price consolidates there briefly, then leaves with a few large candles. The sharp exit shows that aggressive buying or selling at that price far exceeded the opposing orders available to fill it, so the balance between buyers and sellers was clearly lopsided.
There are two kinds of zones:
| Zone | Location | How it forms | When price returns |
|---|---|---|---|
| Demand zone | Below price | Pause, then rally | May find support |
| Supply zone | Above price | Pause, then drop | May meet resistance |
Why Price May React When It Returns
Supply and demand theory offers two common explanations:
-
① Unfilled orders: large players often build positions in pieces during the pause. When price leaves quickly, some of those orders may be left unfilled, and they may get filled when price comes back
-
② Traders who missed the move: traders who missed the first move often wait for price to return to where the rally or sell-off began before getting in
Both are theoretical explanations. A candlestick chart cannot confirm whether unfilled orders are actually sitting in a zone, so price may react when it returns or it may cut straight through.
2. Supply and Demand Zones vs. Support and Resistance
| Item | Supply and demand zone | Support and resistance |
|---|---|---|
| Based on | Where price left sharply | Where price reacted often |
| Drawn as | A zone with two edges | A line or a zone |
| Most valued | Untested zones | Levels with many reactions |
Support and resistance looks at where price has repeatedly reacted in the past. A supply and demand zone looks at which consolidation price left sharply, and how fast and how far it moved away.
Both can be drawn as zones, and both can stop working after repeated tests or a breakout. Areas where a supply and demand zone lines up with support or resistance usually get more attention from traders.
3. The Four Supply and Demand Patterns
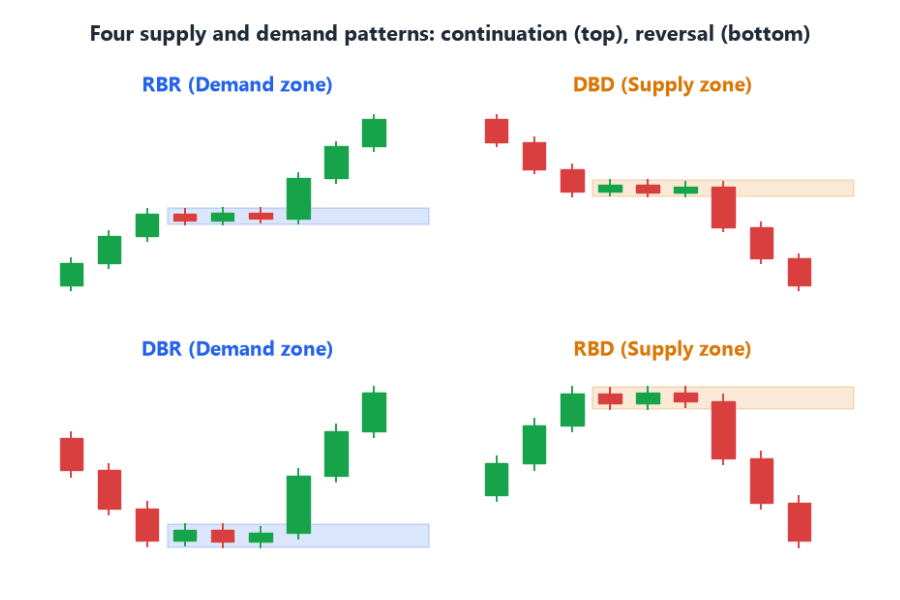
Every supply and demand zone is made of three parts: the move into the consolidation, the consolidation itself (the base), and the move out of it. The direction of the moves before and after the base gives four patterns:
| Pattern | Price path | Zone | Type |
|---|---|---|---|
| RBR | Rally, base, rally | Demand | Continuation |
| DBD | Drop, base, drop | Supply | Continuation |
| DBR | Drop, base, rally | Demand | Reversal |
| RBD | Rally, base, drop | Supply | Reversal |
R stands for rally, D for drop and B for base.
What Counts as a Base
A base is the short consolidation just before price leaves sharply. It usually has these features:
-
It is made of a few small-bodied candles, commonly one to six
-
The range between its highs and lows is narrow, and volatility has clearly contracted
-
It is followed by a clear move made of large candles
Charts are full of sideways periods, but only the ones followed by a sharp move away are worth marking as supply and demand zones.
Continuation Patterns: RBR and DBD
-
RBR (rally, base, rally): price pauses partway through a rally and then surges again. The pause becomes a demand zone, showing that fresh buying came in during the rally. If price later pulls back to it, traders often treat it as a buy-the-dip area in the uptrend
-
DBD (drop, base, drop): price pauses partway through a decline and then falls sharply again. The pause becomes a supply zone, showing that fresh selling came in during the decline. If price later rallies back to it, traders often treat it as a sell-the-rally area in the downtrend
Reversal Patterns: DBR and RBD
-
DBR (drop, base, rally): price falls, consolidates near the low and then rallies sharply. The demand zone forms at the end of the decline, showing that selling was absorbed and buyers took control
-
RBD (rally, base, drop): price rises, consolidates near the high and then drops sharply. The supply zone forms at the end of the rally, showing that buying faded and sellers took control
Continuation patterns follow the existing trend and suit traders waiting for a pullback within that trend. Reversal patterns appear where the trend may be turning and go against it, so traders usually wait for more confirmation before entering.
4. How to Draw Supply and Demand Zones
Using a demand zone as an example:
-
① Find the sharp move: look for one or more large bullish candles that show price rallying quickly
-
② Look back for the base: the small-candle consolidation just before those large candles is the zone to draw
-
③ Draw the proximal and distal lines: the edge closer to the current price is the proximal line, and the edge farther away is the distal line
-
④ Extend the zone to the right: project the zone forward and wait for price to come back and test it
Here is the common way to place the two lines:
| Line | Demand zone | Supply zone |
|---|---|---|
| Proximal | Highest body in the base | Lowest body in the base |
| Distal | Lowest low of the base | Highest high of the base |
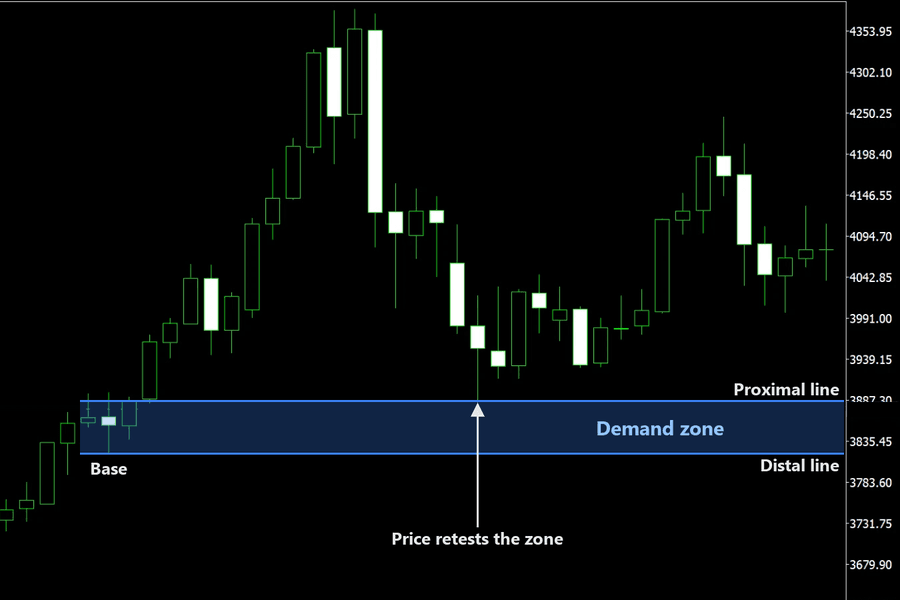
Some traders draw the proximal line at the wicks instead. A wider zone is more likely to be reached, but it also puts your stop farther away. Pick one method and use it consistently.
5. How to Judge the Strength of a Zone
-
Speed of the exit: the larger and more consecutive the candles leaving the base, the bigger the imbalance and the more likely the zone is to hold
-
Length of the base: shorter is better. A long consolidation suggests that many orders were already filled there, so fewer may be left
-
Whether it has been tested: an untested zone, often called a "fresh" zone, usually produces the strongest reaction on the first return
-
Whether it broke market structure: if the rally from a demand zone also took out the previous swing high, it changed the market structure as well. This is the same as a BOS in Smart Money Concepts (SMC), and such zones tend to deserve more attention
-
Agreement with the bigger trend: demand zones in an uptrend and supply zones in a downtrend are trend-following trades, which usually puts the odds more in your favor. Use multiple time frame analysis to confirm the direction on a higher timeframe first
-
Room to the next zone: the distance from a demand zone up to the next supply zone is the potential profit on the trade. If that room is too small, the risk-reward ratio is not worth it
6. How to Trade Supply and Demand Zones
Trading a zone means deciding three things up front: where to enter, where to place the stop and where to take profit. There are two ways to enter, and the difference is whether you wait for price to react inside the zone first. The stop is based on the distal line, and the target is based on the next opposing zone.
Entry Methods
-
Limit order at the proximal line: the order fills as soon as price returns to the zone, which gives a better entry price, but you get no confirmation that price is actually reacting
-
Wait for confirmation: when price enters the zone, hold off until a candle shows rejection, such as a long lower wick or an engulfing pattern, and then enter. The entry price is worse, but it filters out some of the moves that slice straight through the zone
Stop Loss and Targets
For a long trade from a demand zone:
-
Stop loss: a short distance below the distal line, so normal volatility does not trigger it
-
Target: near the proximal line of the next supply zone above, or the prior high
If price closes clearly below the distal line, the zone has failed and you should exit at your stop. For a short trade, reverse everything: enter near a supply zone and place the stop above its distal line.
Example: Buying at a Demand Zone
The example below uses hypothetical EUR/USD prices:
| Item | Price |
|---|---|
| Proximal line | 1.0800 |
| Distal line | 1.0770 |
| Entry | 1.0795 |
| Stop loss | 1.0760 |
| Target (supply zone above) | 1.0870 |
Price returns to the demand zone and prints a long lower wick around 1.0790, and you buy at 1.0795. The stop sits 10 pips below the distal line at 1.0760, a risk of 35 pips. The target is the proximal line of the supply zone above at 1.0870, a potential gain of 75 pips, for a risk-reward ratio of about 1:2.1.
7. Spotting Order Clusters with a Titan FX Tool
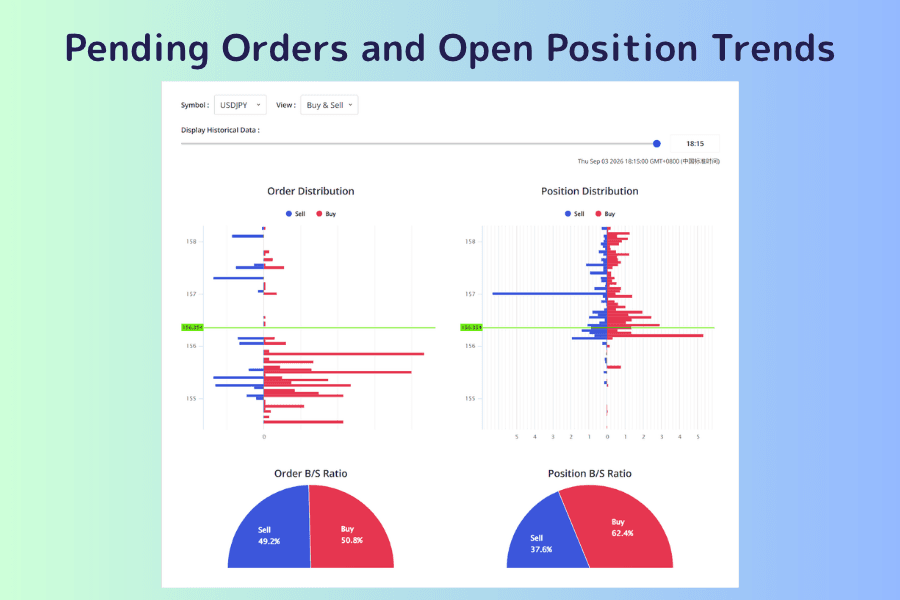
Titan FX's Pending Orders and Open Position Trends tool shows the order distribution and position distribution at each price level for major instruments as bar charts, along with buy/sell ratios and historical data.
Unusually long bars in the order distribution mark prices where orders are clustered, which are candidates for support or resistance. A supply and demand zone is found from past price action, while the order distribution shows where orders are clustered now. Where the two overlap, the level is worth watching more closely.
The data is a sample of orders collected by the tool. It is not the order book of the entire forex market, and it cannot confirm whether large institutional orders are actually sitting in a zone. An overlap does not guarantee a reversal either.
Open Pending Orders and Open Position Trends8. Limitations and Risks
-
Drawing zones is subjective: which consolidation counts as the base, and whether the proximal line uses bodies or wicks, varies from trader to trader
-
Major news can break zones: around economic data releases and central bank decisions, price can cut straight through a zone, and a gap can cause your stop to slip
-
Broken zones can flip roles: once a demand zone is clearly broken, it may act as an area of selling when price later rallies back to it
-
Always use a stop loss: a zone only raises the odds of a reaction at that price. It does not guarantee a reversal, so manage the risk on every trade
9. FAQ
Q1. Are supply and demand zones the same as support and resistance?
No. Support and resistance focuses on where price has repeatedly reacted, while a supply and demand zone focuses on which consolidation price left sharply, and untested zones are usually given the most weight.
Q2. Which timeframe should I use to draw supply and demand zones?
Zones drawn on higher timeframes such as the daily or 4-hour chart are usually more reliable. Lower timeframes produce more zones but also more noise. A common approach is to find zones on a higher timeframe and time entries on a lower one.
Q3. Will price always reverse when it returns to a zone?
No. A zone only marks where buying and selling were once out of balance, and price can break straight through it. Wait for a rejection signal inside the zone and always set a stop loss.
Q4. How many tests can a supply and demand zone take before it stops working?
There is no fixed number. The first return is generally thought to produce the strongest reaction, and each later test may leave fewer orders in the zone, so its effect usually fades over time.
Q5. What is the difference between a supply and demand zone and an order block, and can I use both?
Both describe the area before a strong move. A supply and demand zone usually covers the whole consolidation, while an order block focuses on the last opposite candle before the move, so it is narrower. You can use them together, for example by drawing the supply and demand zone first and then using the order block inside it to narrow your entry.
Q6. Which markets can I use supply and demand zones in?
Supply and demand zones are based only on price action, so they work on any instrument with a candlestick chart, including forex, gold, stock indices and crypto. More volatile instruments break through zones more often, so size your stop distance to the instrument's volatility.
10. Conclusion
A supply and demand zone is a price area that price left sharply after a brief pause. Demand zones sit below price and supply zones above it, and the moves before and after the pause form four patterns: RBR, DBD, DBR and RBD. To draw one, find the large candles that left the area, then mark the pause before them with a proximal line and a distal line.
Zones that price left quickly, after a short pause, that are still untested, that broke market structure and that agree with the bigger trend tend to deserve the most attention. You can enter near the proximal line with a stop beyond the distal line, but no zone guarantees a reversal, so use a stop loss on every trade.
Further Reading
The financial markets research team at Titan FX. We produce educational content across a broad range of instruments, including forex (FX), commodities (crude oil, precious metals, agricultural products), equity indices, U.S. stocks, and crypto assets.
Primary Sources
- Tool details: Titan FX Pending Orders and Open Position Trends tool page (order distribution, position distribution and buy/sell ratios)