
 Home
- Investment Guide: Strategies for Stocks, Forex, and Metals
- Breakout Trading Strategy: Entries, Stop-Loss and Targets
Breakout Trading Strategy: How to Trade Breakouts, Set Stop-Loss and Profit Targets

After a period of consolidation, a break of a key level that attracts follow-through buying or selling can start a new trend. A breakout can also fail, with price falling back into the old range. The strength of breakout trading is its clear entry conditions. The weakness is that false breakouts are common, and many breakout strategies have a low win rate, relying on a few trades that run far to cover the stop losses.
This guide covers which levels are worth waiting for, the volatility contraction that often comes before a breakout, three entry methods, how to set stops and targets, and a worked example using the Asian session range.
- Start with a clear level, such as the edges of a range, horizontal support and resistance, trendline and chart pattern boundaries, or session highs and lows
- Volatility contraction, such as narrowing Bollinger Bands or falling ATR, often comes before a breakout
- There are three entry methods: on the break, on the close, and on the retest. Entering later helps avoid false breakouts but makes it more likely you'll miss the move
- Place the stop loss on the other side of the breakout level, and use the range height projected in the breakout direction as a target
- Win rates are often low, so keep risk per trade fixed and accept a run of small losses
- 1. What Is Breakout Trading?
- 2. Which Levels Are Worth Waiting For?
- 3. Before the Breakout: Volatility Contraction
- 4. Three Ways to Enter a Breakout
- 5. How to Set Stops and Targets
- 6. Asian Session Breakout Strategy: A EUR/USD Example
- 7. How to Reduce the Impact of False Breakouts
- 8. Common Breakout Trading Mistakes
- 9. FAQ
- 10. Conclusion
1. What Is Breakout Trading?
When price moves back and forth between support and resistance, buyers and sellers are roughly balanced. When price breaks through one side and holds, that balance may have shifted. Stop orders sitting outside the range and new breakout orders often get filled together at this point, so volatility jumps for a short time. Whether the move continues depends on whether buyers or sellers follow through.
There are two kinds of breakout: price trades through the level during the candle but doesn't necessarily close beyond it, or the candle closes beyond the level. A close beyond the level is more reliable, but the entry price is worse. Section 4 compares the two.
Breakout trading means entering in the direction of the break at this point. It's the opposite of range trading:
| Aspect | Breakout trading | Range trading |
|---|---|---|
| View of the range edges | Expects price to break through | Expects price to reverse |
| Entry | After an edge is broken | Near an edge, against the move |
| Best market conditions | Consolidation ending, trend starting | Ongoing consolidation |
| Main risk | A false breakout sends price back into the range | A real breakout carries price far away |
Breakout trading is a form of trend following that aims to catch a trend at its start.
2. Which Levels Are Worth Waiting For?
The first step is to find a level that other traders can see too. The more attention a level gets, the more orders sit around it, and the clearer the move tends to be when it breaks. Common levels include:
-
The edges of a range: price reverses several times at the same highs and lows, forming the box described in box theory
-
Horizontal support and resistance: previous highs and lows, and round numbers
-
Trendline and chart pattern boundaries: breakouts from consolidation patterns such as triangles and flags often signal that the trend will continue
-
Session highs and lows: the previous day's high and low, or the high and low of the Asian session. Price action after the European session opens gets particular attention
The length of the consolidation, how many times the level has been tested, and the width of the range are all worth considering, but the number of touches alone can't tell you how reliable a breakout will be. Repeated tests of a level can also mean the orders resting there are being used up.
3. Before the Breakout: Volatility Contraction
Before some breakouts, price swings get smaller. Candles shorten and highs and lows draw closer together. The market lacks direction for now, and short-term volatility drops.
Common tools for spotting this include:
-
Bollinger Band width: narrowing bands mean volatility is falling, often called a squeeze. See Bollinger Bands trading strategies for how to use it
-
ADX: ADX measures trend strength, not volatility. A reading that stays low means there's no clear trend, which is common in a range. The Titan FX indicator Titan_ADX_Range draws the high and low of the range while ADX stays low and shows an arrow when price closes beyond it
-
ATR: a falling reading means the average size of each candle is shrinking
Contraction only tells you the market may be about to move. It doesn't tell you which way, so wait for price to actually break out.
4. Three Ways to Enter a Breakout
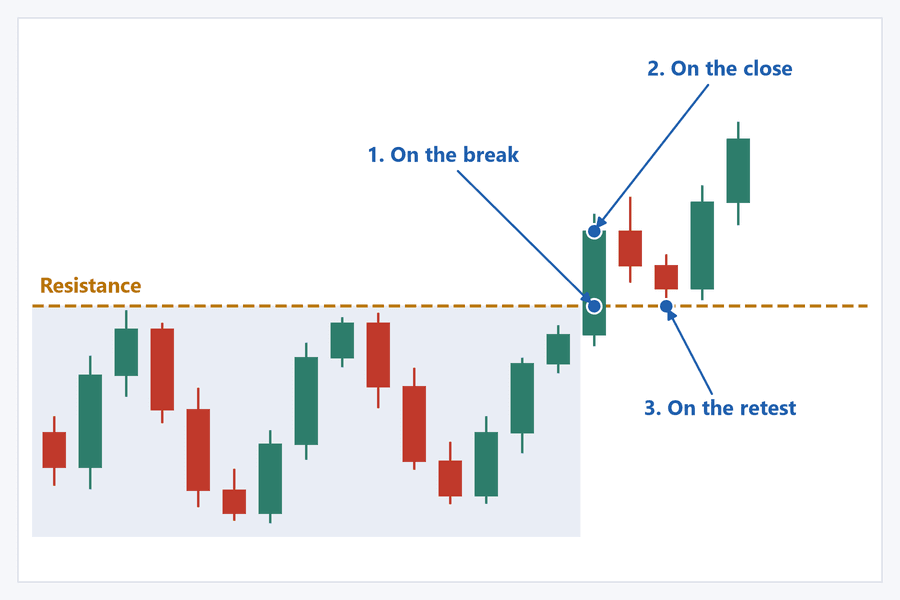
| Entry method | How it works | Advantage | Drawback |
|---|---|---|---|
| On the break | Filled once price crosses the level | You won't miss the move | Most exposed to false breakouts |
| On the close | Enter after a close beyond the level | Filters out brief intrabar breaks | Worse entry, wider stop |
| On the retest | Enter on a retest that holds | Tighter stop, fewer false breakouts | Strong breakouts may not retest |
Entering on the break usually means placing a stop entry order beyond the level: a buy stop for an upside break, a sell stop for a downside break. Price moves fast during a breakout and spreads can widen, so the order may not fill at the price you set. Entering on the close doesn't guarantee success either, since price can still return to the range after the close.
No method is always better. When the market is choppy and false breakouts are common, entering on the close or the retest makes sense. For a breakout after a long consolidation with a clear trend, entering on the break is an option. Either way, work out your risk per trade first.
5. How to Set Stops and Targets
Stop loss
Place the stop loss where reaching it would mean the breakout has failed, usually on the other side of the breakout level. For an upside breakout, common choices are:
-
Below the low of the breakout candle
-
Below the midpoint of the range
-
Below the bottom of the range, which gives price the most room but means the widest stop
The farther away the stop, the smaller the position needs to be to keep risk per trade at the same amount. If price closes back inside the range and stays there, the breakout has failed. Exit as planned.
Target
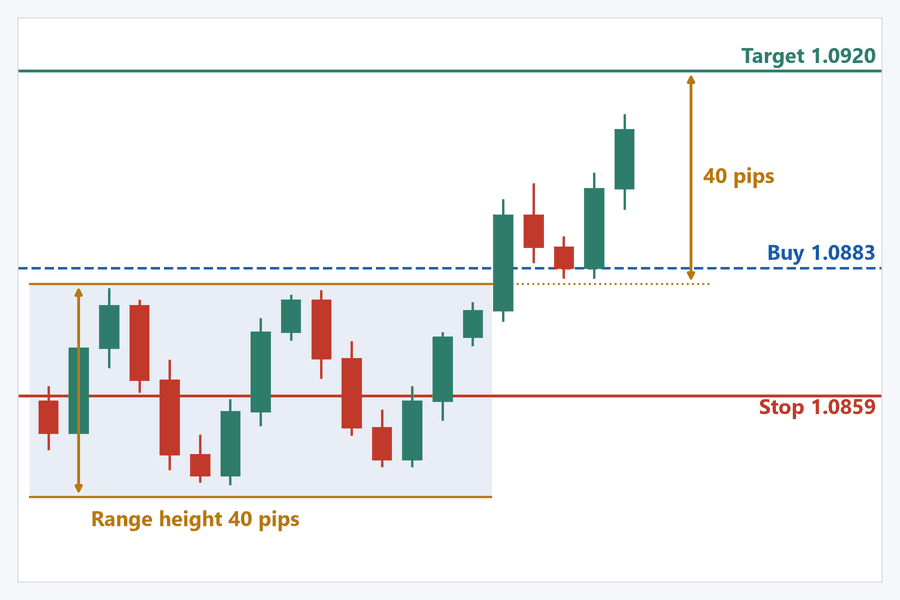
A common approach is the measured move: take the height of the range (top minus bottom) and project it from the breakout level in the direction of the break. For example, if the range runs from 1.0840 to 1.0880, a height of 40 pips, the first target after an upside break is around 1.0920. It's only a guide, and not every breakout gets there.
You can also target a previous high or low or a round number, or scale out and let part of the position ride the trend. Before you enter, check that the risk-reward ratio is worth it.
6. Asian Session Breakout Strategy: A EUR/USD Example
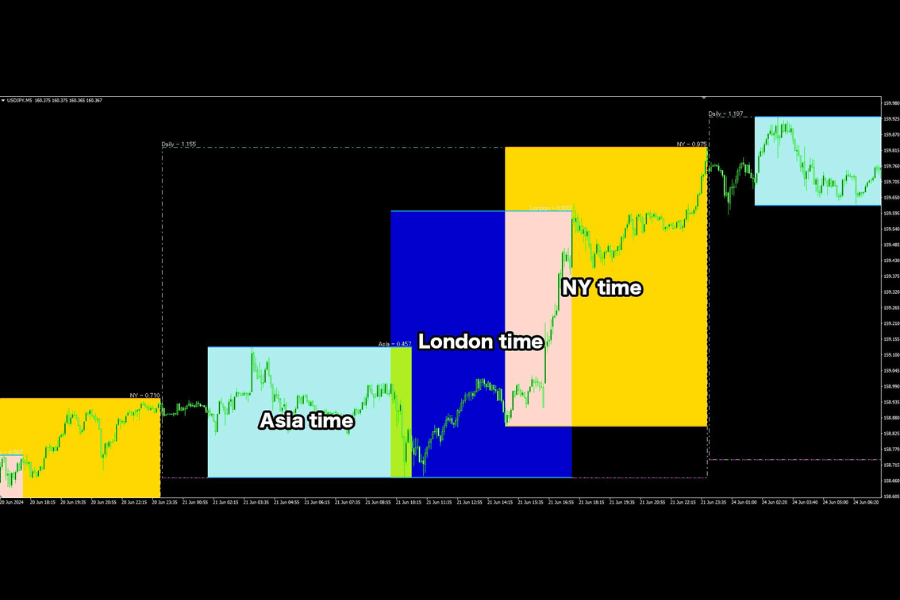
Many major currency pairs move relatively little during the Asian session, so price often consolidates in a narrow range. Once the European session opens and more participants arrive, price may break out of that range, but it may also keep consolidating. For more on session characteristics, see our guide to the London session.
To mark session highs and lows, you can use the Titan FX MT4/MT5 indicator Titan_Time_Range. It draws a box around the high and low of each set time range and shows its size. By default it has three boxes, Asia, London, and New York, set in MT4/MT5 server time to 02:00–11:00, 10:00–18:00, and 15:00–24:00. You can change these times.
Example: hypothetical figures, entering on the retest on the EUR/USD 15-minute chart
Range: the Asian session high is 1.0880 and the low is 1.0840, a height of 40 pips, with a midpoint of 1.0860
Breakout: after the European session opens, a candle closes above 1.0880
Entry: price pulls back to around 1.0880 without falling back into the range, so you buy at 1.0883
Stop and target: the stop goes below the midpoint at 1.0859, a risk of 24 pips. The measured-move target is 1.0920, a potential gain of 37 pips, for a risk-reward ratio of about 1:1.5. This stop level is for illustration; adjust it to volatility and spreads in practice
If price quickly closes back below 1.0880 after the break and doesn't recover, the breakout has failed. Stay out, or exit at your stop.
This indicator works only on the Windows versions of Titan FX MT5 and MT4.
View Titan_Time_Range7. How to Reduce the Impact of False Breakouts
A false breakout is the biggest risk in breakout trading. When price moves through a level and quickly returns to the range, anyone who entered in the breakout direction gets stopped out.
The main way to reduce the impact is to add one more confirmation to your entry rules, such as waiting for the close, requiring the break to exceed a certain distance, or waiting for price to stay beyond the level for a few candles. Our false breakout guide covers these filters in detail, along with how to trade a failed breakout.
Two other habits matter just as much, regardless of your entry rules:
-
Check the higher timeframe: breakouts in the direction of the higher-timeframe trend are usually more reliable than those against it
-
Avoid major data releases: around a release, price may spike one way and then reverse, which makes breakout signals unreliable
8. Common Breakout Trading Mistakes
-
Treating every minor high as a breakout: a vague level touched only once tells you little when it breaks. Wait for a clear range or pattern first
-
Chasing a breakout that has already run: entering after price has moved a long way means a wider stop and a worse risk-reward ratio
-
Reversing straight after a false breakout and getting stopped out again: a failed breakout doesn't mean price must go the other way. You still need your own entry conditions before reversing
-
Increasing size after a string of losses: a run of small losses is normal in breakout trading. Sizing up to win it all back at once lets risk get out of control
9. FAQ
Q1. Which timeframe works best for breakout trading?
Any timeframe works. Lower timeframes produce more breakouts but also more false ones; breakouts on the 4-hour and daily charts are rarer, but each one carries more weight. Beginners may want to start with the 1-hour chart or higher.
Q2. What is the win rate of breakout trading?
There's no fixed figure; it depends on the instrument, the timeframe, and your entry rules. Breakout strategies generally have low win rates and depend on winners being larger than losers, so your stop loss and position size matter more than the win rate.
Q3. If price falls back into the range after a breakout, should I exit right away?
It depends on the rules you set in advance. If your stop is at the range midpoint or the bottom of the range, a brief return into the range doesn't require an early exit until the stop is hit. If price keeps closing inside the range, the premise of the breakout no longer holds.
10. Conclusion
Breakout trading follows a clear process: find a well-defined level, watch for volatility contraction before the break, choose an entry method, place the stop on the other side of the level, and estimate a target from the range height.
Win rates are often low, so you need to accept a run of small losses. Keep risk per trade fixed, avoid major data releases, and treat false breakouts as part of the strategy.
Further Reading
Titan FX Research Team. We cover a broad set of financial instruments — foreign exchange, commodities (crude oil, precious metals, agricultural products), equity indices, US equities, and digital assets — producing practical, research-backed educational content for traders.
Primary Sources (by Category)
- Titan FX tools: Titan_Time_Range and Titan_ADX_Range indicator pages (accessed November 9, 2026)
- Technical analysis methods: range breakouts, volatility contraction, and the measured move are standard methods in technical analysis