6 Practical Bollinger Bands Trading Strategies: From Mean Reversion and Squeeze Breakout to Double Bollinger Bands

Bollinger Bands are one of the first technical indicators most beginners learn, yet most traders eventually run into the same problem — "I understand the theory, but how do I actually trade with them?"
Understanding the theory is just the starting point; applying it effectively in real markets is where profit comes from. Instead of rehashing the basics, this article takes you straight into practical application: from mean-reversion strategies in range-bound markets, to Squeeze breakouts before big moves, to trend-following Band Walks, plus the advanced Double Bollinger Band zoning method recommended by John Bollinger himself.
We'll also cover high-probability combinations with RSI and MACD, and the three most common mistakes traders make — so you can apply Bollinger Bands more effectively in forex and CFD trading, improving both win rate and consistency.
- 1. Three Things to Know Before Using Bollinger Bands
- 2. Strategy 1: Mean Reversion (Range-Bound Markets)
- 3. Strategy 2: Squeeze Breakout (Major Move Launch)
- 4. Strategy 3: Band Walk (Strong Trend Following)
- 5. Strategy 4: Double Bollinger Band 5-Line Zoning
- 6. Strategy 5: Bollinger Bands + RSI Combo
- 7. Strategy 6: Bollinger Bands + MACD Combo
- 8. Three Common Mistakes in Real Trading
- 9. FAQ: Bollinger Band Strategies
- 10. Summary: Three Core Principles
1. Three Things to Know Before Using Bollinger Bands
Before diving into strategies, let's nail down three critical prerequisites. They sound simple but are the root cause of over 80% of trader mistakes.
First: Bollinger Bands Are a Volatility Tool, Not a Direction Predictor
At their core, Bollinger Bands measure the magnitude of market volatility — they don't tell you which direction price is going. The upper and lower bands are simply statistical boundaries at ±2 standard deviations, not magical support or resistance levels.
Many traders assume "touch the upper band, sell; touch the lower band, buy." In strong trends this assumption gets punished repeatedly. Bollinger Bands can tell you "how wide or narrow volatility is" and "how far price is from the average," but direction must come from other tools.
Second: Markets Spend 70% in Ranges, 30% in Trends
This is a well-known statistical rule in forex and stock markets. For most of the time, Bollinger Bands look like a squeezed sideways pattern — big moves are relatively rare.
This reality directly impacts strategy choice:
- Range markets suit mean-reversion strategies (trading bounces off the upper/lower bands)
- Trending markets suit breakout and band-walk strategies (following the trend)
Using the wrong strategy in the wrong market = consistent losses. Learning to identify the current market type is more important than learning any single strategy.
Third: There's No "Best" Parameter Setting — Only the Right One for You
The default 20-period SMA + ±2σ is what John Bollinger himself recommends as a robust baseline. But depending on instrument, timeframe and trading style, you may need to tweak it:
| Trading Style | Suggested Period | Suggested Std Dev |
|---|---|---|
| Scalping (5-min / 15-min) | 10 | ±1.9σ |
| Intraday / Swing (1h / 4h) | 20 | ±2σ |
| Position (Daily / Weekly) | 50 | ±2.1σ |
After adjusting parameters, always backtest on historical data — never blindly copy someone else's settings.
2. Strategy 1: Mean Reversion (Range-Bound Markets)
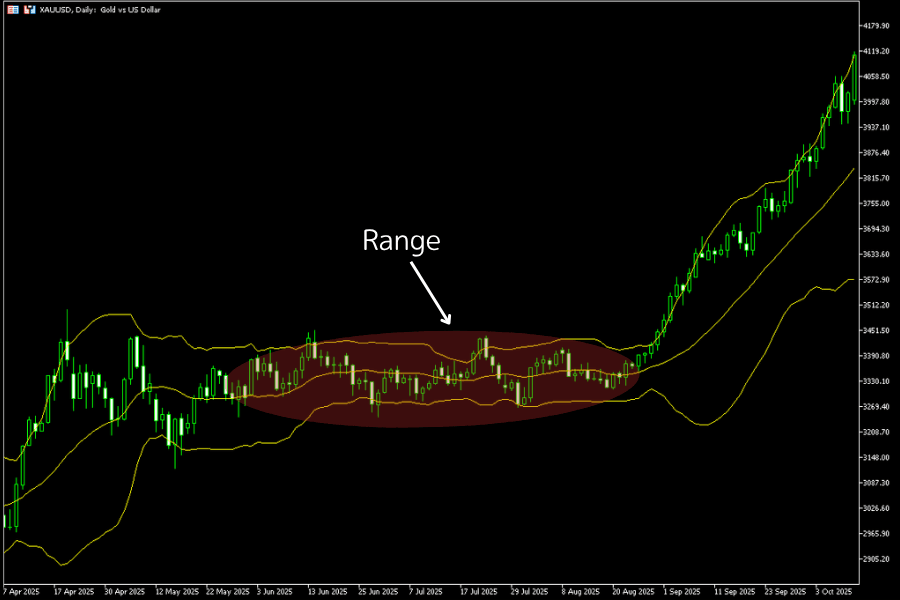
Core logic: When the market lacks a clear trend and price oscillates inside the Bollinger Bands, touches of the upper band tend to revert toward the middle band, and touches of the lower band tend to bounce back to the middle.
Conditions (all 3 must be met):
- Bollinger Band width is not wide (upper and lower bands stay relatively constant, no sharp expansion)
- The overall channel is horizontal (middle band slope close to 0)
- Price has already oscillated within the channel at least twice
Entry signals:
-
Short: Price touches upper band with a bearish candle or long upper wick
-
Long: Price touches lower band with a bullish candle or long lower wick
-
Stop loss: Above the high / below the low of the entry candle + 1 × current ATR
-
Take profit: Back to the middle band (conservative) or the opposite band (aggressive)
Risk warning: The moment the channel starts expanding or the middle band slope shifts noticeably, stop using this strategy — a trend may be starting.
3. Strategy 2: Squeeze Breakout (Major Move Launch)
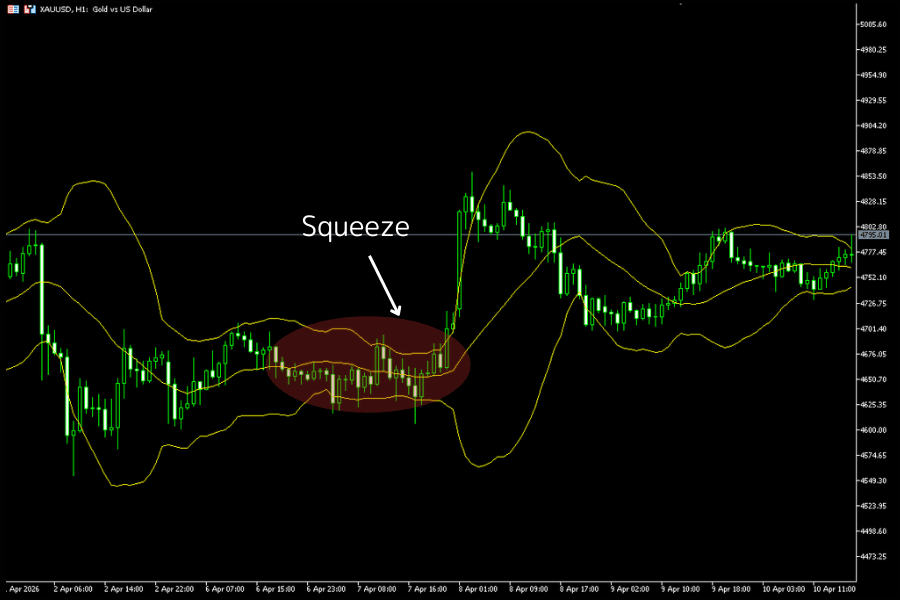
Core logic: When Bollinger Bands contract sharply (Squeeze), market volatility has been compressed to extremely low levels. Statistically, high and low volatility periods alternate, so extreme compression is often followed by a major move.
Squeeze criteria:
- BandWidth contracts noticeably to relatively low levels over the recent 3–6 months
- You can use the BB_Width indicator from Titan FX for quick reading
Entry signals:
- Price closes above the upper band → Long
- Price closes below the lower band → Short
- Volume (if tick volume available) expands simultaneously
False breakout filters (important):
-
Only enter on close, intraday wicks don't count
-
Combine with Keltner Channels: when Bollinger Bands are "inside" Keltner Channels it's called a TTM Squeeze; only a breakout beyond Keltner is considered valid
-
If price retreats back into the channel within 3 candles after breakout, exit immediately
-
Stop loss: The opposite side of the channel (e.g., for longs, below the lower band at breakout time)
-
Take profit: Use a trailing stop to ride the trend
4. Strategy 3: Band Walk (Strong Trend Following)
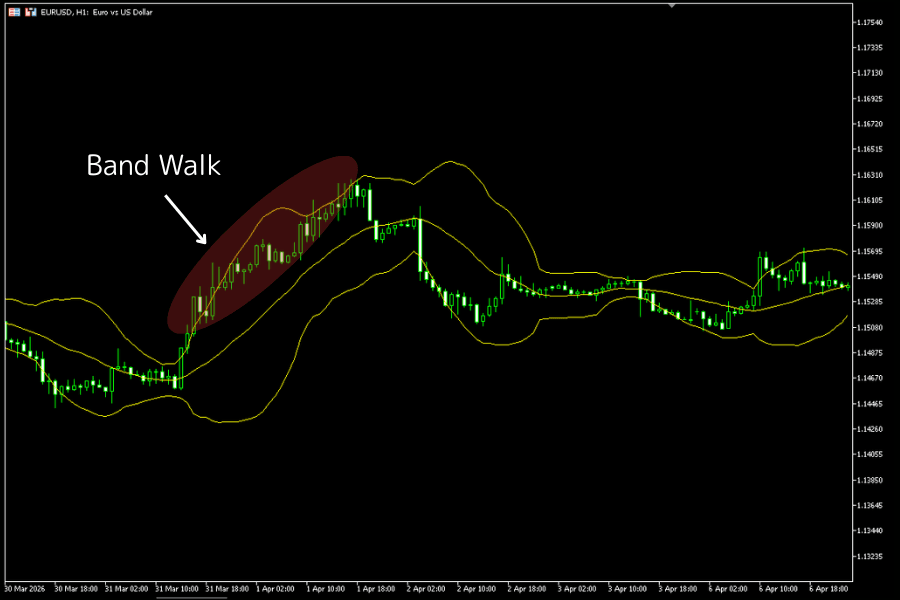
Core logic: When the trend is strong enough, price "walks along" the upper or lower band — this is called a Band Walk. Never counter-trend fade in this situation.
Real vs Fake Band Walk:
| Feature | Real Band Walk (follow) | Fake Band Walk (avoid) |
|---|---|---|
| Middle band slope | Clearly up / down | Near horizontal |
| Candle structure | Solid bodies, few wicks | Long wicks, many dojis |
| Channel opening | Expanding or stable | Starting to contract |
| Pullback depth | Doesn't break middle band | Repeatedly crosses middle band |
- Entry: After confirming a real Band Walk, enter on pullbacks to the middle band or ±1σ line in the direction of trend
- Stop loss: Exit immediately on a close below (or above) the middle band
- Take profit: Trailing stop — each new high (or low) shifts the stop to above the previous swing low (or high)
Put These Bollinger Bands Strategies into Action
Titan FX offers leverage up to 1000x (varies by instrument and account type), with ultra-tight spreads and fast order execution. Full support for MT4/MT5 plus free advanced indicators such as BB_Width and Multi-timeframe Bollinger Bands, so you can apply the six strategies above to forex, indices, metals, and more.
5. Strategy 4: Double Bollinger Band 5-Line Zoning
This is the advanced method recommended by John Bollinger in his book Bollinger on Bollinger Bands. Plotting both ±1σ and ±2σ bands simultaneously divides price action into five strength zones.
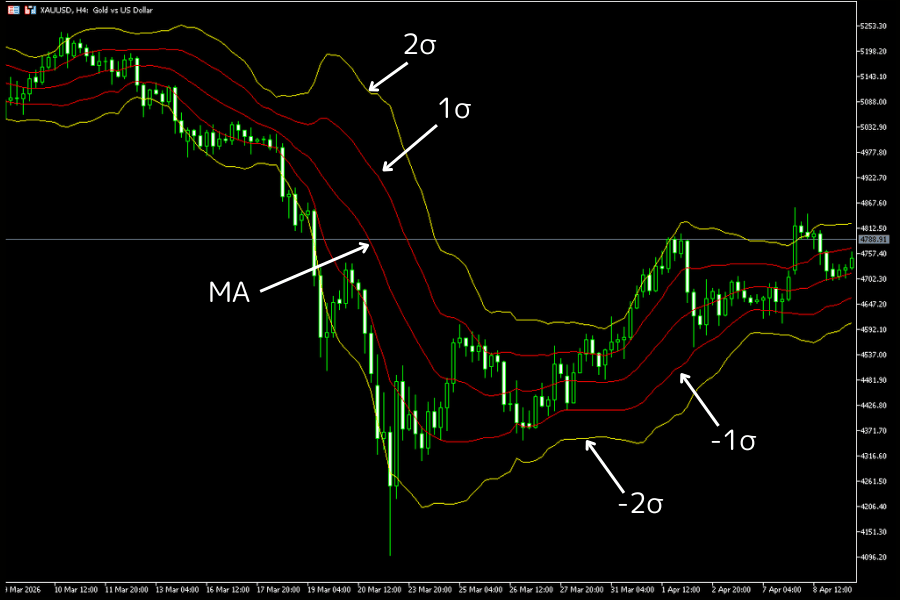
The Five Zones
| Zone | Location | Meaning | Suggested Action |
|---|---|---|---|
| Extreme Strong | Above +2σ | Severely overbought but trend strong | Hold existing longs; no new entries |
| Strong | +1σ to +2σ | Bulls in control | Buy on pullback to +1σ |
| Neutral | -1σ to +1σ | No clear direction | Stay flat, or use mean-reversion |
| Weak | -2σ to -1σ | Bears in control | Sell on bounce to -1σ |
| Extreme Weak | Below -2σ | Severely oversold but downtrend strong | Hold existing shorts; no new entries |
Application Tips
- Don't force trades in the Neutral zone: -1σ to +1σ is the most random area with lower win rate.
- The golden entry is the pullback into Strong/Weak zones: Buying at +1σ after pulling back from +2σ offers far better win rate and reward/risk than chasing entries at +2σ.
- Watch for zone transitions: When price sinks from Strong to Neutral to Weak zones consecutively, the trend may be reversing.
6. Strategy 5: Bollinger Bands + RSI Combo
The biggest weakness of Bollinger Bands alone — no directional judgment. Adding a momentum indicator dramatically improves win rate.
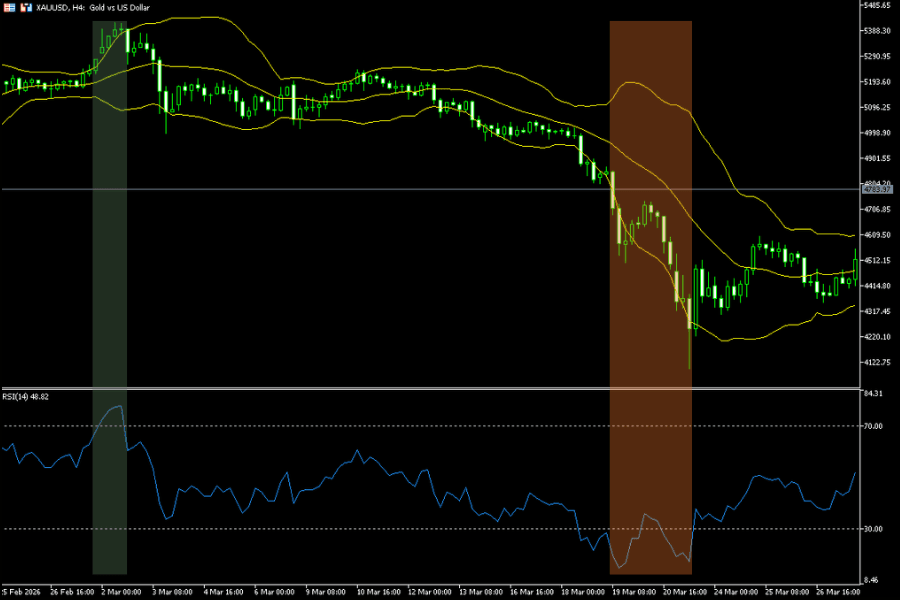
Using RSI as a "confirmation layer":
- Price touches upper band + RSI > 70 → double-confirmed overbought, higher probability short
- Price touches lower band + RSI < 30 → double-confirmed oversold, higher probability long
RSI divergence signals (high-probability advanced technique):
- Bearish divergence: Price makes a new high but RSI doesn't → upward momentum exhausting, watch for reversal
- Bullish divergence: Price makes a new low but RSI doesn't → downward momentum exhausting, watch for bounce
- If price also touches the Bollinger band edge at the same time, the signal strength increases further
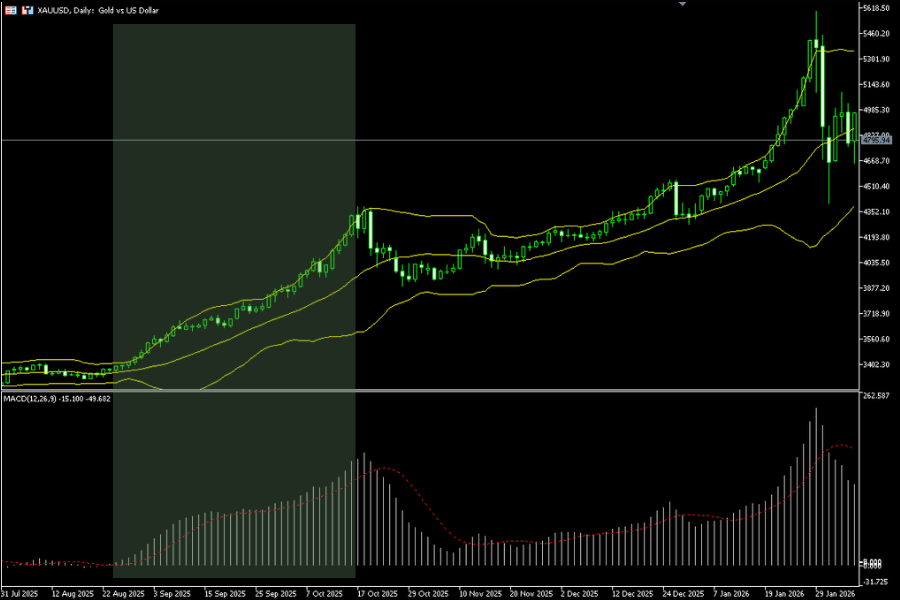
7. Strategy 6: Bollinger Bands + MACD Combo
Since Bollinger Bands don't judge direction, let MACD do it.
Note on MT5 MACD display: MT5's built-in MACD differs from MT4 and TradingView — the MACD main line is shown as a histogram (not a solid line), while the signal line is a dotted line. The steps below assume MT5.
Workflow
Step 1: Use the MACD histogram to determine trend direction
- Histogram persistently above zero → bullish trend
- Histogram persistently below zero → bearish trend
- Histogram oscillating near zero → no clear direction, stand aside
Step 2: Use Bollinger Bands to find entry points
- In a bullish trend, go long only, entering on pullbacks to the middle band
- In a bearish trend, go short only, entering on rallies to the middle band
Step 3: Use histogram vs signal line to confirm timing
- Histogram crosses signal line from below upward → buy-side momentum recovering, entry signal for longs
- Histogram crosses signal line from above downward → sell-side momentum recovering, entry signal for shorts
- Histogram expanding → momentum strengthening, hold the position
- Histogram shrinking → momentum weakening, consider exiting or tightening stops
This "direction first, timing second" approach is one of the most robust trend-following setups.
8. Three Common Mistakes in Real Trading
Mistake 1: Entering Based Only on Band Touches
Wrong approach: Short every time price touches the upper band and long every time it touches the lower, regardless of trend state.
Why it fails: In strong trends, price can walk along the upper band for 20+ candles (the "Band Walk" we discussed). Shorting blindly is like catching a falling (or rising) knife.
Correct approach: First identify whether the market is ranging or trending (ADX indicator or middle band slope helps), and only apply mean-reversion in ranges.
Mistake 2: Using Default Parameters on Short Timeframes
Wrong approach: Trading 5-minute charts with 20-period SMA + ±2σ defaults.
Why it fails: 20 periods on a 5-minute chart represents only 100 minutes of data — too few samples, leading to overly reactive bands, too many signals, and low quality.
Correct approach: Shorten the period to 10–14, lower std dev to ±1.9σ, and always combine with another filter. Alternatively, switch to a higher timeframe (15-minute or 1-hour) for much better signal quality.
Mistake 3: Applying Technical Indicators to News Events
Wrong approach: Continuing to use Bollinger Bands to trade through major events like U.S. Non-Farm Payrolls, FOMC rate decisions, etc.
Why it fails: Bollinger Bands are lagging indicators calculated from past prices — they can't respond to sudden news. During news, the channel expands instantly and price punches through the bands; any entry is likely to be stopped out by a "giant candle."
Correct approach:
- No new positions within 30 minutes before and after major events
- For existing positions, widen stops slightly or scale out
- To trade news events, use dedicated strategies (pending-order breakouts, fundamental interpretation, etc.) — don't rely on technical indicators
9. FAQ: Bollinger Band Strategies
Q1: Which strategy has the highest win rate?
Looking purely at "signal win rate," Band Walk (Strategy 3) is highest at 60–70%, but its frequency is low (a handful of strong trends per year). Mean Reversion (Strategy 1) triggers more often but with lower win rate (~50–55%). High win rate doesn't equal more profit — reward-to-risk and signal frequency matter just as much.
Q2: Can I use Bollinger Bands alone without other indicators?
Technically yes, but not recommended. Bollinger Bands don't judge direction or distinguish trend from range, so using them alone makes it easy to apply the wrong strategy to the wrong market. At minimum, pair with a trend indicator (MACD, moving averages) or a momentum indicator (RSI).
Q3: Should I use MT4 or MT5?
Both have built-in Bollinger Bands with identical core functionality. MT5 supports more timeframes, faster backtesting, and a richer set of custom indicators. Titan FX offers several free advanced Bollinger Bands indicators (Multi-timeframe Bollinger Bands, BB_Width, etc.) that work on both MT4 and MT5.
Q4: Does a Squeeze always lead to a big move?
No, not always. A Squeeze is a "high probability precursor," not a guarantee. About 70% of Squeezes are followed by valid breakouts; the remaining 30% produce fakeouts or continue consolidating. That's why false breakout filtering (close confirmation, volume, Keltner combination) is so important.
Q5: How much data is needed for reliable strategy testing?
At least 2–3 years of historical data with 100+ trade samples is needed for statistical significance. You should also separate "bull," "bear," and "sideways" market conditions and check performance in each — a genuinely good strategy should remain profitable in at least two of the three.
10. Summary: Three Core Principles
Bollinger Bands are a powerful tool, but what actually determines trading results isn't the indicator itself — it's the user's understanding of the market. Remember these three principles:
Principle 1: Identify Market Type First, Choose Strategy Second
Mean-reversion in ranges, Squeeze breakouts at trend ignitions, Band Walk in strong trends. Never apply the wrong strategy in the wrong market.
Principle 2: Bollinger Bands Should Never Be Used Alone
Always pair with at least one directional indicator (MACD / moving averages) or momentum indicator (RSI). Combined use filters out many false signals and significantly boosts win rate.
Principle 3: Enforce Stop Losses Strictly and Follow the Trend
- Mean Reversion: stop loss must be tighter than take profit (reward/risk ≥ 1:1.5)
- Breakout: exit immediately on failure
- Band Walk: always exit on close below/above middle band
- In Band Walks, don't try to pick tops or bottoms — let the trend carry you