

Donchian Channel Explained: Calculation, Turtle Breakout Strategy, and the Bollinger Bands Comparison

The Donchian Channel is a channel indicator drawn from the extremes of recent price action: the upper band is the highest high of the past N periods, the lower band is the lowest low, and the middle line is their average — so reaching the upper or lower band means price is printing a new high or low for that window. It was created by Richard Donchian, often called the father of trend following and best known for his four-week rule. The famous Turtle experiment of the 1980s used 20-day and 55-day breakouts as the entry conditions of its two systems, paired with shorter-period reverse breakouts for exits — and turned this indicator into a byword for breakout trading.
There is no shortage of channel indicators; what sets the Donchian Channel apart is how plain it is. Its boundaries are simply the recent highs and lows anyone can see on the chart, and a break of the upper band is the event itself — a new high — with no statistical processing involved. The rules are simple, yet they carry the core logic of the trend-following school: trends start from new highs and new lows.
This article covers how the Donchian Channel is calculated and structured, the breakout strategy and the Turtle rules, how it differs from Bollinger Bands, the caveats in practice, and how to load it in MT4/MT5 — including the Free Indicators pack bundled with Titan FX.
- Upper band = highest high of the past N periods; lower band = lowest low; middle line = their average. The most common setting is 20.
- The core use is breakouts: a break above the upper band is a long signal, a break below the lower band a short or exit signal; the Turtles entered on 20/55-day breakouts and exited on 10/20-day reverse breakouts.
- Channel width reflects the trading range of the past N periods: contraction means price action is compressing, and only a fresh band update with expanding width signals that a new trend may be unfolding.
- Versus Bollinger Bands: Donchian draws its boundaries from extremes, so touching a band means a new high or low; Bollinger draws them from standard deviations.
- The Donchian Channel is not on the standard MT4/MT5 indicator list, but Titan FX's MT5 ships it in the Navigator's Free Indicators folder, ready to load.
- 1. What Is the Donchian Channel?
- 2. How the Donchian Channel Is Calculated: The Three Lines
- 3. How to Trade It: The Breakout Strategy and the Turtle Rules
- 4. Donchian Channel vs Bollinger Bands
- 5. Caveats When Using the Donchian Channel
- 6. How to Display the Donchian Channel in MT4/MT5
- 7. Donchian Channel FAQ
- 8. Summary
1. What Is the Donchian Channel?
The Donchian Channel consists of three lines: one tracing the highest high of the past N periods, one tracing the lowest low, and a middle line at their average. How a breakout is judged depends on the calculation basis. If the channel includes the current bar, price can never trade outside it; if the bands are built from the previous N periods excluding the current bar, then a current price above the prior N-period high constitutes an upside breakout, and a price below the prior N-period low a downside breakout (Section 2 unpacks the two conventions).
Richard Donchian, the indicator's creator, was a pioneer of trend following and managed futures, and his famous four-week rule could hardly be simpler: buy when price makes a new four-week high, sell when it makes a new four-week low. The Donchian Channel draws that rule onto the chart, turning "new high, new low" from a phrase into two boundary lines that move with the market.
The indicator earns its keep by converting a trend-following entry condition into a well-defined event. Nobody can predict where a trend will start, but every major trend has to pass through one station: the break of recent highs or lows. The Donchian Channel stands waiting at that station.
2. How the Donchian Channel Is Calculated: The Three Lines
The three lines are defined as follows:
- ① Upper band = the highest high of the past N periods
- ② Lower band = the lowest low of the past N periods
- ③ Middle line = (upper band + lower band) ÷ 2
A quick numeric example: if the highest high of the past 20 periods (excluding the current bar) is 1.1050 and the lowest low is 1.0850, the upper band sits at 1.1050, the lower band at 1.0850, and the middle line at 1.0950. The moment the current price trades above 1.1050, a new 20-period high breakout is in place.
The most common setting for N is 20 — roughly one month of trading days and the entry parameter of Turtle System 1 — while longer-term systems often use 55. One detail deserves attention: implementations differ on whether "the past N periods" includes the current bar. The classic Turtle rules use the prior N periods excluding the current bar — otherwise the current price could never "break" the band. Custom indicators in the MQL5 community are written both ways, so check before relying on one.
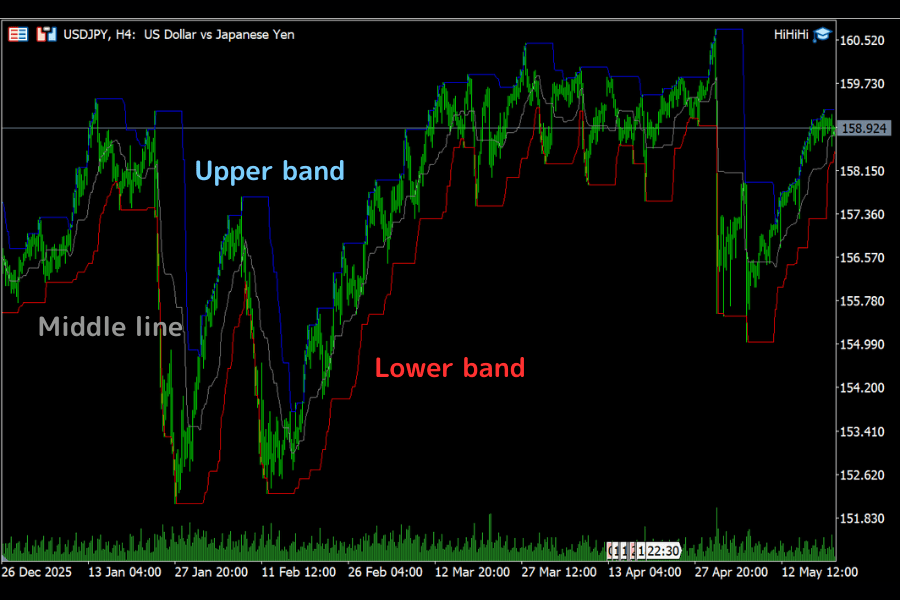
The channel's shape is information in itself. The distance between the bands measures the trading range of the past N periods: contraction means price action is compressing, and only when the boundaries get updated and the width starts expanding again does it signal that a new leg may be forming. A flat upper band means the highs have gone unchallenged for a while; a flat lower band means the lows are holding — and the staircase direction of the channel is the direction of the trend.
3. How to Trade It: The Breakout Strategy and the Turtle Rules
The basic playbook for the Donchian Channel is to enter on a breakout and exit on the reverse breakout — a classic trend following tool.
Entry Rules
A break above the 20-period upper band counts as a long signal; a break below the 20-period lower band counts as a short signal. Forex trades in both directions, so both breakouts are equally playable. To cut down on intraday head-fakes, the common practice is to wait for a closing price to confirm the breakout, or to require price to hold a certain distance beyond the band before entering.
Exit Rules
A breakout system hands its exits to the channel as well: longs are closed when price breaks below a shorter-period lower band (10 periods, for example), and shorts the other way around. Some traders also use the middle line as a trend reference or an auxiliary trailing exit, though that is not a core rule of the four-week system or the Turtle rules. The exit period is kept shorter than the entry period so that profits are banked early in a reversal without being shaken out by minor pullbacks.
The Full Turtle Framework
The 1980s Turtle experiment wrapped Donchian breakouts into a complete system: System 1 entered on a 20-day breakout and exited on a 10-day reverse breakout; System 2 entered on 55 days and exited on 20. Stops and position sizing were handed to a volatility unit called N — a moving average of the True Range, conceptually the same thing as today's ATR (Average True Range): the initial stop went 2N away from entry, and position size was derived from N so that every market carried the same per-trade risk. The real heart of the Turtle method is money management — the breakout signal decides when to get in and out, and N decides how much to bet each time.
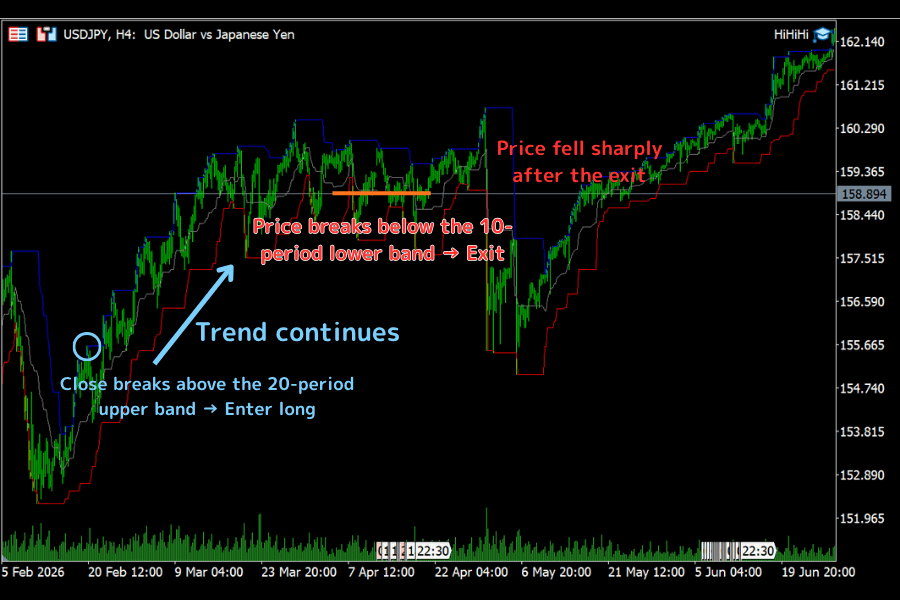
Be mentally prepared for a breakout system's personality. It does not rely on a high win rate: most breakouts end as small losses or small gains, and the profits concentrate in riding a handful of big trends all the way through. Streaks of consecutive stop-outs are normal for this class of system, and what carries you through them is strict stops and position control — which is exactly where execution gets tested hardest.
4. Donchian Channel vs Bollinger Bands
Channel indicators both, yet the Bollinger Bands draw their boundaries from an entirely different idea:
| Comparison | Donchian Channel | Bollinger Bands |
|---|---|---|
| How the boundary is defined | Highest high / lowest low of N periods (extremes) | Moving average ± k standard deviations (statistical dispersion) |
| What touching a band means | A new recent high or low (an event) | Price sits k standard deviations from the average |
| Typical use | Breakout trend-following | Volatility analysis, mean reversion, Squeeze breakouts |
| How the bands move | Staircase — they move only when highs/lows update | Smooth and continuous — they shift with every bar |
The two serve different roles and complement each other: use the Donchian Channel when you want "new high / new low" as an entry event, and Bollinger Bands when you want to measure how far price has strayed from its average and whether volatility is contracting or expanding. In the same market, a Bollinger Squeeze and a narrowing Donchian Channel often show up in close succession — both are side-evidence that a consolidation is winding up for a break.
5. Caveats When Using the Donchian Channel
① Ranging markets are the natural enemy of breakout systems. When price goes sideways, the channel narrows, the bands sit close together, and price keeps brushing the boundaries only to fall back. Chains of false breakouts are the main source of losses for breakout systems. In a market clearly suited to range trading, trend-side breakouts run into consecutive fakeouts and stop-outs far more easily — better to wait for signs of channel expansion before engaging.
② Breakout entries are fated to feel like chasing. At the moment the rules put you in, a long is bought near the N-period high and a short sold near the N-period low — not a comfortable feeling. That is the nature of the approach: a relatively late entry price is the fee paid for the chance to catch, as far as possible, every confirmed breakout. If that trade-off is unacceptable, full execution becomes very difficult.
③ Add a trend filter on top. Taking only the breakouts that agree with the bigger picture filters out a good share of the fakeouts. A common method is to judge direction with a higher-timeframe moving average: take only upside breakouts while price holds above the long-term average, and only downside breakouts below it.
④ Stops and sizing are the other half of the system. Define the bail-out point for a failed breakout in advance — the opposite shorter-period band, the middle line, or a multiple of N away from entry are the usual choices. Scale position size to volatility, trading smaller in wilder markets so that the money at risk per trade stays constant. Without this half, no breakout signal survives the losing streaks.
6. How to Display the Donchian Channel in MT4/MT5
The Donchian Channel is not on the standard built-in list in MT4/MT5 — you will not find it under the Trend, Oscillators, Volumes, or Bill Williams groups in "Insert" → "Indicators". On Titan FX's MT5, though, there is nothing to install: it ships with the platform's bundled indicator pack.
Method 1: load it from the Navigator panel (bundled with Titan FX MT5). Open the Navigator panel, expand "Indicators" → "Free Indicators", find "Donchian Channel", and double-click it or drag it onto the chart. In the settings window that appears, the "Inputs" tab holds the period parameter; adjust it and apply. The same folder carries other channel tools worth exploring, including the Keltner Channel and the Camarilla Channel.
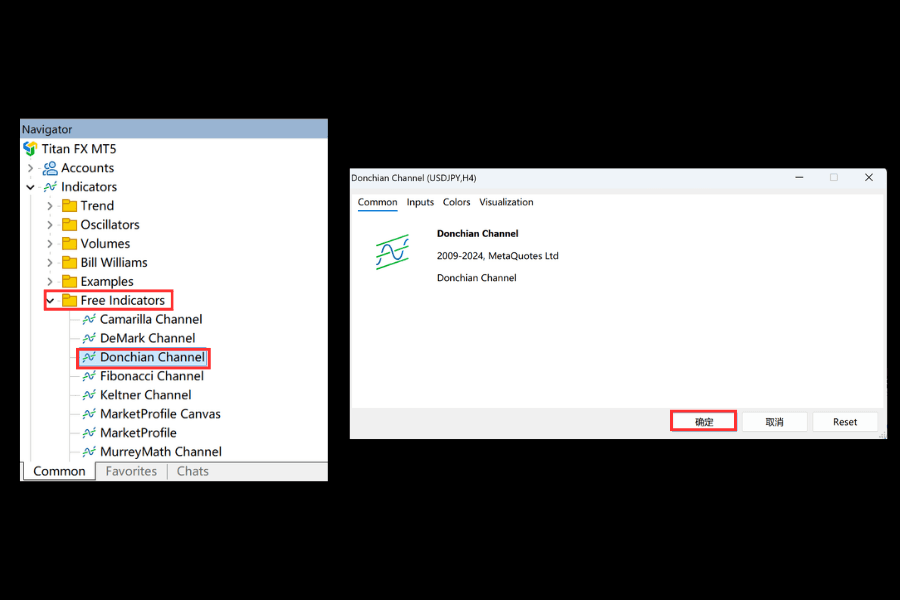
After loading, check two things: the default value of N, and whether the calculation includes the current bar (see Section 2) — implementations vary between versions. If your environment does not bundle such indicators (some MT4 setups, for example), custom indicators are available from the official MQL5 community Code Base; mind the source, and never install .ex4/.ex5 files of unknown origin.
Method 2: mark the levels by hand. Skipping the indicator, you can draw horizontal lines at the highest high and lowest low of the past 20 periods — functionally a static pair of Donchian boundaries, good enough when you only care about a single breakout level. The drawback: the lines need redrawing every time a new high or low prints.
For the full list of custom indicators Titan FX provides, see the page below.
All Custom Indicators7. Donchian Channel FAQ
Q1: What period should the Donchian Channel be set to?
The most common setting is 20 periods — roughly a month of trading days and the entry parameter of Turtle System 1. Longer-term systems use 55, and exits often run on shorter settings such as 10. The principle is that the entry period stays longer than the exit period. There is no single right answer; backtest against your trading timeframe and instrument before settling on one.
Q2: Can the Donchian Channel be used together with Bollinger Bands?
Yes — they do different jobs. The Donchian Channel turns "new high / new low" into a clean entry event, while Bollinger Bands measure how far price sits from its average and whether volatility is contracting or expanding. One practical combination: let a Bollinger Squeeze flag that a consolidation is winding up, and use the Donchian breakout as the action trigger.
Q3: Why can't I find the Donchian Channel in my MT5?
Because it is not in the standard built-in groups under "Insert" → "Indicators". Titan FX MT5 users should look in the Navigator panel instead: expand "Indicators" → "Free Indicators" and double-click "Donchian Channel" to load it. If your platform does not bundle it, download a custom indicator (most are free) from the official MQL5 community, or draw horizontal lines at the recent high and low by hand.
Q4: Should I buy the moment price touches the upper band?
Not recommended. An intraday touch can turn out to be a momentary wick. The common filters are waiting for a close to confirm the breakout, requiring a minimum breakout distance or holding time, and screening by the higher-timeframe trend direction — together they remove a good share of the fakeouts. The cost is a slightly worse entry price, which is the trade-off built into breakout trading.
Q5: Do the Turtle rules still work today?
The edge of the original parameters has faded as market structure changed and the rules became public knowledge, and copying the 1980s settings as-is guarantees nothing. The framework, however — defining entries and exits with channel breakouts and controlling risk and size with N (ATR) — remains the foundation of trend-following systems today. Borrow the framework and backtest your own parameters; that beats memorizing the original numbers.
Q6: Which instruments and timeframes suit the Donchian Channel?
Instruments with a tendency to trend, and larger timeframes. Breakout signals on the daily and H4 charts are comparatively dependable, while noise and fakeouts multiply as the timeframe shrinks. Major forex pairs, gold, and equity indices all work; the keys are avoiding clearly range-bound conditions and matching your money management to the instrument's volatility.
Q7: Does the Donchian Channel repaint?
Not in the sense of rewriting history. The highs and lows of completed bars are fixed, so historical channel positions never get redrawn after the fact. What does happen is that as the rolling window advances, the oldest extreme drops out of the N-period range and the channel updates by rule. Separately, versions that include the current unfinished bar in the calculation will show the bands moving with live price — a property of the calculation basis, so check which type your indicator is before using it.
8. Summary
The Donchian Channel turns "new high, new low" into visible boundary lines with the least processing an indicator can get away with. Break the upper band to enter, fall through the shorter lower band to exit, and hand stops and sizing to N (ATR) — that is the skeleton of the breakout system the Turtles made famous. The channel's width and staircase direction throw in a reading of volatility and trend for free.
Before putting it to work, accept the breakout system's character: the entry prices look ugly, the win rate will not carry you, and ranging markets will string stop-losses together. The profits come from riding a few big trends to the end. Use the Donchian Channel as the event trigger, leave the filtering to the higher-timeframe trend, and leave survival to stops and position management — and this tool, shaped more than half a century ago, remains the most intuitive starting point trend following has to offer.
Further Reading
- 6 Practical Bollinger Bands Trading Strategies: From Mean Reversion and Squeeze Breakout to Double Bollinger Bands
- Trendlines: How to Draw Them, Judge Validity, and Confirm Breakouts
- Fractals Indicator Explained: Formation Rules, Breakout Strategy & Stop-Loss Placement
- Parabolic SAR: How to Read It, Parameter Settings, and Trailing Stops
- Momentum Indicator: Formula, How to Read It, and Divergence
Titan FX Research Team. We cover a broad set of financial instruments — foreign exchange, commodities (crude oil, precious metals, agricultural products), equity indices, US equities, and digital assets — producing practical, research-backed educational content for traders.
Primary Sources (by Category)
- Theory and history: Richard Donchian's four-week rule and the trend-following literature; the Turtle rules as published in Curtis Faith, "Way of the Turtle" and Michael Covel, "The Complete TurtleTrader"
- Textbook: the channel and breakout-system chapters of John J. Murphy, "Technical Analysis of the Financial Markets"
- Platform documentation: Titan FX MT4/MT5 and the bundled Free Indicators pack; the Donchian Channel custom indicators of the MQL5 community