

Fractals Indicator Explained: Formation Rules, Breakout Strategy & Stop-Loss Placement
Fractals is a pattern-marking tool created by Bill Williams. Using a simple five-candle rule, it automatically marks swing highs and swing lows on the chart with small arrows. An upward arrow marks a local high (an up fractal), a downward arrow marks a local low (a down fractal) — turning "where did this swing actually turn?" from a subjective judgment into an objective marker.
Most indicators tell you the direction of the trend or the strength of momentum. Fractals answers a more basic question: what does the market's swing structure look like — where is the previous swing high, where is the previous swing low? These are precisely the reference points every trader hunts for when drawing trendlines, placing stops, or judging breakouts. Fractals marks them automatically, and it is built into MT4/MT5 with nothing to install.
This guide covers what the Fractals indicator is and where it comes from, the five-candle formation rule and its confirmation lag, three practical uses (reading swing structure, fractal breakouts, and anchoring stops and trendlines), which indicators to pair it with, and how to display and set it up in MT4/MT5.
- Fractals marks swing highs and lows using a five-candle rule: a middle candle whose high exceeds the highs of the two candles on each side forms an up fractal; a middle low below the two on each side forms a down fractal.
- A fractal needs the two candles to its right to close before it is confirmed, so the signal inherently lags by about two candles — the first thing to accept before using it.
- Three uses: objectively mapping swing structure, entering with-trend on breaks of the nearest fractal, and placing stops beyond the nearest confirmed fractal.
- Fractals itself does not distinguish trend from range; in ranges, up and down fractals alternate rapidly and signals fail quickly, so filter with a trend tool first.
- The built-in MT4/MT5 Fractals indicator has no numeric parameters — add it to the chart and it works.
1. What Is the Fractals Indicator?
Fractals was introduced by the celebrated technical analyst Bill Williams in his book Trading Chaos, as one of the building blocks of his chaos-trading framework. The name borrows from the geometric concept of fractals — market structure repeating similar shapes across timeframes — with each swing's basic unit being a turning point defined by highs and lows. Note that the MT4/MT5 Fractals indicator does not compute anything from fractal geometry; it is simply the name Williams gave to a specific local high-low pattern.
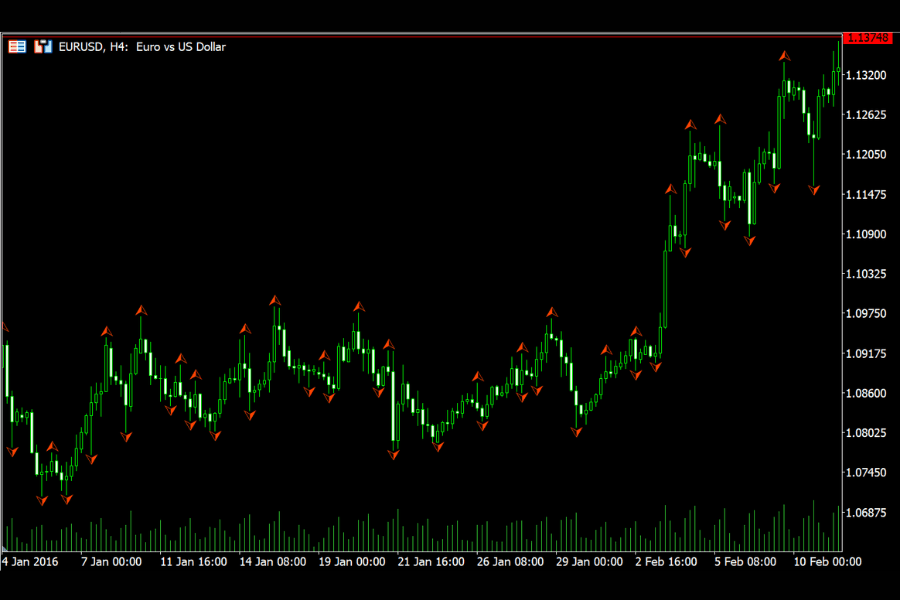
Its display could not be simpler: the indicator overlays small arrows on the candlestick chart — an upward arrow above a local high (up fractal), a downward arrow below a local low (down fractal). Beyond marking these turning points, it performs no other calculation.
Because it only marks points, Fractals is often dismissed as "low-information." In reality, swing highs and lows are the most heavily used raw material in technical analysis: trendlines connect them, support and resistance derive from them, and breakouts are judged against them. The value of Fractals is that it extracts this raw material by a fixed rule, removing the subjectivity and omissions of picking points by eye.
2. How to Read Fractals: The Five-Candle Rule
A fractal is defined on a group of five adjacent candles, comparing the middle candle with the two on each side:
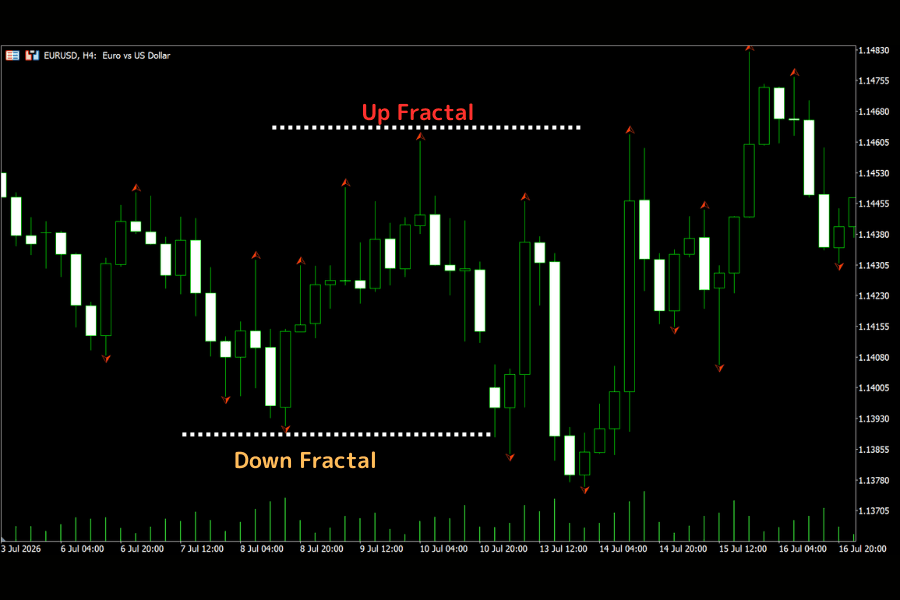
- Up fractal: the middle candle's high is higher than the highs of the two candles on each side — marking a local high, shown as an upward arrow above the candle.
- Down fractal: the middle candle's low is lower than the lows of the two candles on each side — marking a local low, shown as a downward arrow below the candle.
Two preconditions to understand before using it:
① Fractals confirm with a lag. The rule needs the "two candles to the right" to close, so the arrow appears at least two candles after the actual high or low. In other words, by the time you see the arrow, the turn happened a little while ago — Fractals confirms structure; it does not predict turns.
② A confirmed fractal normally does not change. Under the standard five-candle rule, a fractal is officially confirmed once the two candles to the right of the middle candle have closed; confirmed historical marks do not usually move with subsequent price action. A "candidate" fractal whose right-hand candles have not yet completed, however, can be invalidated when a new candle makes a higher high or lower low. If Fractals looks brilliant on historical charts but feels a step slow in real time, this confirmation mechanism is usually why.
Up and down fractals also need not alternate — one-way markets can print several fractals of the same type in a row, and a single candle (a long doji, for example) can even be the center of both an up and a down fractal at once. All of this is normal behavior.
3. How to Use Fractals: Three Practical Applications
Use 1: Map the swing structure and make "highs and lows" objective
Treat Fractals as an automated swing marker: the sequence of up and down fractals is the market's "high — low — higher high…" structure. The most basic trend check — are highs rising, are lows rising? — can be read directly off the fractals: if the more significant fractal highs and lows are stepping up overall, that supports an upward structure; stepping down overall points to a downward one.
Ask several traders to find "the previous swing high" on a candlestick chart by eye and you will get several answers. Fractals produces one consistent answer by a fixed rule — particularly useful for reviewing trades and building trading plans.
Use 2: Fractal breakouts for with-trend entries
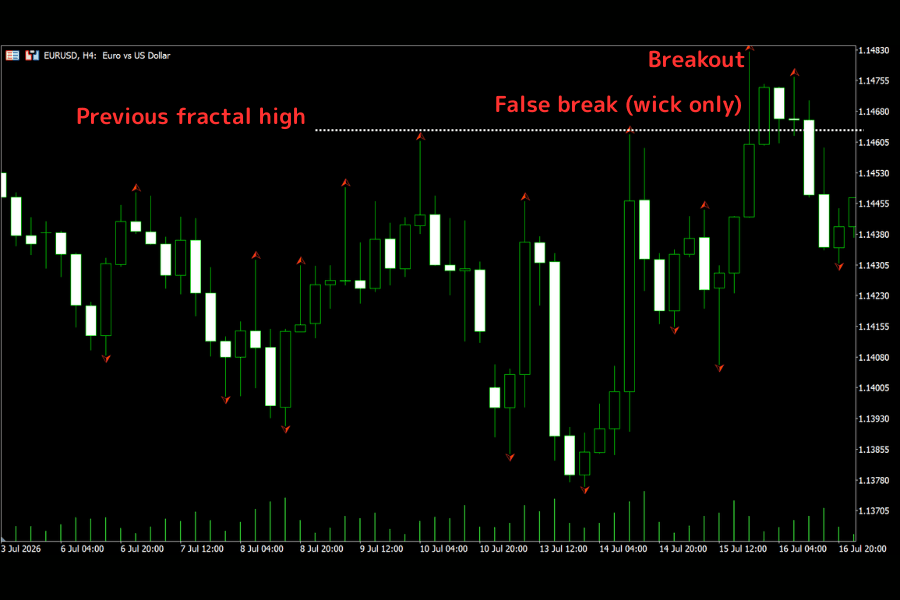
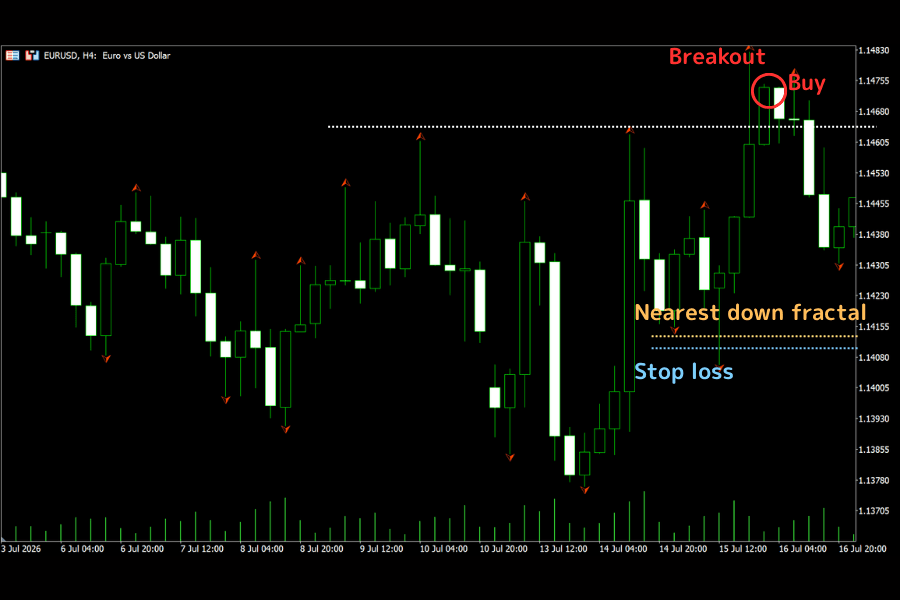
In Bill Williams' trading system, the fractal breakout is one component of the entry signal, normally executed only after tools like the Alligator define the market state. Taken on its own, a close above the most recent up fractal's high, or below the most recent down fractal's low, is an objective reference that the market has cleared its previous local extreme.
Why is clearing the previous high a reason to buy? Go back to how an up fractal forms: it is where the last advance stopped — price reached that level, and the next two candles failed to make a higher high, meaning selling pressure capped the buyers there at the time. If price later returns and closes above that high, that layer of supply has been absorbed and this advance has exceeded the previous one's limit; simultaneously, a "higher high" is born and the upward structure extends. That is exactly why trend followers treat this moment as a buy reference — and the logic for selling a break of a down fractal is perfectly symmetrical.
Two practical details:
- Wait for a candle close to confirm the break, or watch for a successful retest, to reduce entries triggered by a wick poking through for a moment — cutting losses from false breakouts.
- Take only breakouts aligned with the larger direction: in ranging markets, up and down fractals get broken in turn, and trading both sides just stacks up stop-outs. Define the direction first with a moving average or the tools in the next section — in an uptrend, take upside breaks only and skip the downside ones; reverse in a downtrend.
Use 3: Objective anchors for stops and trendlines
The points Fractals marks answer two of the most common questions:
Where does the stop go? One common approach: for longs, reference the area just below the most recent confirmed down fractal's low; for shorts, just above the most recent confirmed up fractal's high — the classic "exit when the prior low breaks" principle, with Fractals supplying the exact location. Note that "most recent" means confirmed as of your entry: a low whose two right-hand candles have not closed yet is only a candidate and cannot anchor a stop (see Section 2). The actual stop distance should still account for the instrument's volatility and spread, so a routine fluctuation does not tag you out.
How do I draw the trendline? Connect fractal highs for a descending trendline, fractal lows for an ascending one — with a rule governing point selection, the lines come out consistent. Cross-check your lines against the levels computed by our support and resistance tool for extra confluence.
4. What to Pair Fractals With
Fractals only marks structure; direction and timing need teammates. Three classic pairings:
① Alligator — the original companion. The filter Bill Williams designed alongside Fractals is his own Alligator (three smoothed, forward-shifted moving averages): take only fractal breakouts in the direction of the "open jaws" — long breaks when the averages fan upward, short breaks when they fan downward — using trend state to screen out counter-trend signals.
② Trend-strength tools (ADX/DMI) — check whether a trend exists first. Fractal-breakout strategies bleed most in ranges. Checking trend strength with ADX/DMI before entering is the most direct filter — the same operating rule as for Parabolic SAR.
③ Momentum — confirm the force behind the break. When price breaks a fractal with momentum strengthening in step, the break is more credible; when price makes a new high while momentum diverges, be on guard for a false break.
5. Weaknesses and Caveats
Confirmation lags by two candles: fractals always appear two candles late, and the lag costs relatively more on shorter timeframes. Treat it as a structure-confirmation tool; do not expect it to catch the first candle of a turn.
Ranges produce dense, quickly failing signals: in sideways markets, up and down fractals alternate, and following each one risks a string of stop-outs. Judge the market state first; in a range, use fractals only as references for the range boundaries rather than chasing breakouts.
Fractals do not come in sizes: the rule sees only five candles' relative positions, so an arrow from a major turn looks identical to one from minor noise. Watching higher-timeframe fractals (say, daily first, one-hour second) keeps the focus on larger-scale structure and reduces overreaction to short-term flutter.
Insufficient as a standalone entry basis: it measures neither trend direction nor momentum — it is a marking tool and does not generate complete entry signals on its own. Always build the strategy with the filters from Section 4, and set the stop the moment you enter.
6. Setting Up Fractals in MT4/MT5
Fractals is built into MT4/MT5 — nothing to install. In MT5, from the menu at the top of the chart select Insert → Indicators → Bill Williams → Fractals, and the arrows are overlaid directly on the candles in the main chart. The menu path is essentially identical in MT4 and MT5; the screenshot below shows MT5.
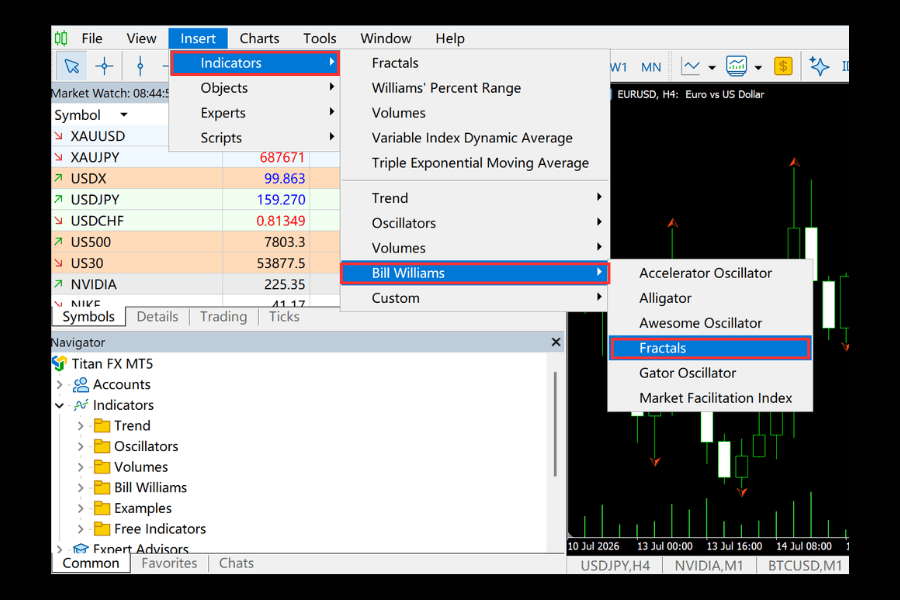
The settings window has no numeric parameters — the five-candle rule is fixed, and all you can adjust is the arrows' color and style. To change sensitivity, do not look for a parameter; switch timeframes instead — the higher the timeframe, the more significant the turns the fractals represent. To browse the full list of indicators the platform offers, see the page below.
All Custom Indicators7. FAQ
Q1: Does the Fractals indicator repaint?
Under the standard five-candle rule, a fractal is officially confirmed once the two candles to the right of its middle candle have closed, and confirmed historical fractals do not normally move with later price action. Only candidate fractals — those whose two right-hand candles have not yet completed — can be invalidated. That is the confirmation mechanism working as designed, not a flaw.
Q2: Which timeframes suit Fractals best?
Any timeframe works, but every one of them waits for the two right-hand candles to close; the shorter the timeframe, the higher the frequency of both noise and fractal prints, and the denser the markers. The standard workflow uses daily or four-hour fractals to define structure and direction, then drops to a lower timeframe to find entries.
Q3: There are so many arrows — should I trade every break?
No. Ranges frequently produce brief breaks that reverse within a few candles, so treating every fractal break as a signal is inappropriate. Combine the trend direction with filters like ADX/DMI and take only breaks aligned with the dominant direction — trade less, and only take with-trend breaks when the trend is clear.
Q4: How is Fractals different from Parabolic SAR?
Both overlay the main chart, but their roles differ: Fractals marks past swing structure (where the highs and lows are), while SAR helps gauge the current trend state and serves as a trailing-stop reference (its dots move with the trend). In practice they complement each other — Fractals defines structure and entry references; SAR assists with trend state and the moving stop.
Q5: Can I change Fractals to 7 or 9 candles?
The built-in MT4/MT5 version is fixed at five candles with no parameters. If you need stricter fractals (three candles on each side, say), a custom indicator can do it; in most cases, simply moving up a timeframe achieves a similar filtering effect.
8. Conclusion
With one simple five-candle rule, Fractals turns the most fundamental raw material in technical analysis — swing highs and lows — into objective, consistent markers on the chart. It inherently lags by two candles and cannot tell trend from range, so its proper role is a structure tool: use it to check whether highs and lows are stepping up, anchor stops at the most recent confirmed fractal, draw trendlines from fractal points — and hand the breakout signals to trend and momentum tools for filtering.
If you regularly hesitate over "where exactly was the previous swing high?" or "where does my stop go?", let the built-in Fractals mark the points for you, and keep your attention on direction and money management — that is the most practical value of this quietly useful indicator.
Further Reading
- RSI: Calculation, Interpretation, and How to Use It in MT4/MT5
- MACD Indicator Explained: Complete Beginner's Guide with Trading Examples
- Moving Averages (MA) Complete Guide: Types, Settings, and Practical Use
- Bollinger Bands Complete Guide: Principles, Standard Deviation, Formula, and Plotting
- Standard Deviation Complete Guide
Titan FX Research Team. We cover a broad set of financial instruments — foreign exchange, commodities (crude oil, precious metals, agricultural products), equity indices, US equities, and digital assets — producing practical, research-backed educational content for traders.
Primary Sources (by Category)
- Trading platform documentation: MetaQuotes MT4/MT5 user guides (the Fractals indicator's definition and display)
- Research and reference: Bill Williams, Trading Chaos (the original definition of fractals and the chaos-trading framework); general treatments of fractals and swing structure in standard technical-analysis references (Investopedia, BabyPips)