

Standard Deviation Explained: Formula, the Limits of the Normal Distribution, and Trading Applications
It is the foundation on which volatility is calculated, and the shared raw material behind Bollinger Bands, the Sharpe ratio, and most risk models. Yet most explanations stop at the formula and the 68-95-99.7 rule, skipping the point that matters more to a trader: market returns are not normally distributed, so the textbook probabilities do not carry over cleanly to extreme conditions.
This article starts with the definition and the calculation, then covers how to read σ in a trading context, where the normal-distribution assumption breaks down, how to use the indicator built into MT4/MT5, and how to turn σ into a stop-loss distance and a position size.
- Standard deviation measures dispersion around the mean, and it is the most common way to quantify volatility.
- There are two versions — population (divide by n) and sample (divide by n−1). Charting platforms almost always use the population figure.
- 68-95-99.7 describes the normal distribution itself. Bollinger Bands actually contain about 90% of the data, and Bollinger himself warns against drawing statistical conclusions from it.
- Returns have fat tails: ±2σ roughly matches theory, but days beyond ±3σ occur about five times more often than predicted.
- σ converts directly into a stop distance and a position size — the most concrete way to use it in practice.
- 1. What Is Standard Deviation? Building the Intuition
- 2. How to Calculate It: Steps, a Worked Example, and Two Formulas
- 3. How to Read Standard Deviation in Trading
- 4. Does ±2σ Really Cover 95%?
- 5. Using the Standard Deviation Indicator (StdDev) in MT4/MT5
- 6. Standard Deviation vs Bollinger Bands vs ATR
- 7. In Practice: Setting Stops and Position Size with σ
- 8. Standard Deviation FAQ
- 9. Summary
1. What Is Standard Deviation? Building the Intuition
Definition: A Measure of Dispersion
Standard deviation measures how widely a set of data is spread around its mean. A larger value means the data points sit further from the average; a smaller value means they cluster close to it.
In markets, that data set is usually a run of closing prices or returns, which makes standard deviation the most direct way to quantify volatility. Two instruments can post the same average return while the one with the higher standard deviation puts you through far bigger swings to get there.
Why Traders Need to Understand It
Standard deviation is not just one more indicator. The upper and lower Bollinger Bands are "moving average ± 2 standard deviations", the denominator of the Sharpe ratio is the standard deviation of returns, and most risk models start from it.
Put differently: if you use technical analysis tools at all, you are already using standard deviation indirectly. Understanding what it means — and where it stops being reliable — is what lets you read what those tools are actually telling you.
2. How to Calculate It: Steps, a Worked Example, and Two Formulas
The Calculation in Four Steps
- 1. Find the mean: add all the values in the period and divide by the count.
- 2. Find each deviation: subtract the mean from each value.
- 3. Find the variance: square the deviations and average them. Squaring makes both positive and negative departures count as positive.
- 4. Take the square root: the square root of the variance is the standard deviation.
The variance produced in step 3 and the standard deviation are two expressions of the same thing. Variance is measured in the square of the original units, which is awkward to interpret; taking the root restores the original units so the figure can be compared directly with price. That is why practitioners work with standard deviation rather than variance.
Working Through Three Numbers
Suppose an instrument closes at 100, 101, and 99 on three consecutive days:
- Mean = (100 + 101 + 99) ÷ 3 = 100
- Deviations = 0, +1, −1
- Squared and summed = 0 + 1 + 1 = 2
- Divided by the count of 3, variance ≈ 0.67; taking the root gives σ ≈ 0.82
The numbers themselves don't matter much — the process does. It turns "how far from average" into a single comparable figure.
Population vs Sample Standard Deviation
There are two possible divisors, and this is where most of the confusion lives.
| Type | Divisor | When it applies |
|---|---|---|
| Population standard deviation | n | Your data is the entire set you care about |
| Sample standard deviation | n−1 | You are estimating a whole from a sample; applies Bessel's correction |
Worth noting: the MT4/MT5 built-in indicator, the original definition of Bollinger Bands, and TradingView's default setting all use the population standard deviation (divide by n).
Using the example above: dividing by 3 gives σ ≈ 0.82, while dividing by n−1 (that is, 2) gives σ = 1.00. Same numbers, different formula, different answer.
Strictly speaking, 20 candles are only a sample of the market, and statistically n−1 is the better-justified choice. But platforms went with n, while Excel's STDEV.S defaults to n−1 — which is exactly why your own spreadsheet check won't match the chart. Over 20 periods the gap is about 2.6%, immaterial for trading decisions as long as you know where it comes from.
3. How to Read Standard Deviation in Trading
There Is No Absolute High or Low
Standard deviation is an absolute figure carrying units, so it shifts with the instrument's price level and the timeframe. Gold's σ cannot be compared directly with EUR/USD's, and a daily σ will naturally exceed a 15-minute one.
What matters is therefore not the number itself but the comparison against its own history: is the current σ high or low relative to the recent past?
Volatility Clusters
Market volatility has one reliably stable property: high volatility tends to be followed by more high volatility, and quiet tends to be followed by more quiet. This is volatility clustering.
That means changes in σ carry information in their own right. A σ turning up from a low base often marks a market shifting out of consolidation into a trend, while a σ that has been elevated and starts contracting is frequently a clue that the volatile phase is ending.
One caveat is worth stating plainly: a rising σ tells you movement has increased, not that a trend has begun. Around a Federal Reserve rate decision, for instance, price can whip violently in both directions and push σ sharply higher while the close ends up back where it started. As a volatility measure, standard deviation captures magnitude, never direction.
Annualising It
To compare across instruments or periods, standard deviation is often annualised by multiplying the daily figure by the square root of the number of trading days:
Annualised volatility = daily standard deviation × √252
252 is the number of US equity trading days in a year, and traders often use ×16 (approximating √256) for mental arithmetic. Foreign exchange trades around the clock but only five days a week, so realised volatility is likewise calculated on a trading-day basis — both 252 and 260 are used, and the difference is only about 1.6%.
The more important distinction is elsewhere: implied volatility quoted in the options market is on a 365 calendar-day basis, roughly 20% away from the trading-day basis above, so the two cannot be compared directly.
Note also that the square-root rule assumes returns are independent of one another. Real markets exhibit volatility clustering, so that assumption fails — the annualised figure is an approximation that can run high or low, and should not be treated as a precise risk ceiling.
4. Does ±2σ Really Cover 95%?
This is the assumption traders most need to correct.
What the Normal Distribution Says
In a normal distribution, about 68.3% of the data falls within ±1σ, 95.4% within ±2σ, and 99.7% within ±3σ. This is the familiar 68-95-99.7 rule.
But those figures describe a property of the normal distribution itself, and they hold only if the data really is normally distributed.
Markets Are Not Normally Distributed
Actual price returns display what is called a fat tail: extreme moves occur more often than a normal distribution predicts. Academic research puts the tail index of financial returns somewhere between 2 and 5, which already rules out the normal distribution, and the property holds from minute bars up to daily data.
John Bollinger, who created Bollinger Bands, addresses this directly in his own published rules: with the default parameters, in practice roughly 90% of the data — not 95% — falls inside the bands. He is also explicit that no statistical assumptions should be drawn from the standard deviation calculation used to build them, because the distribution of security prices is non-normal and the sample size in most deployments is too small to be statistically significant.
First, a Distinction: Two Different "±2σ" Claims
It is easy to conflate two separate things here, so it is worth separating them first.
| Claim | What is being measured | Actual figure |
|---|---|---|
| Bollinger Bands, about 90% | Where price sits relative to bands that move (a moving average ± 2σ) | About 90% inside the bands |
| Return distribution, ±2σ | Where returns sit relative to their own mean and standard deviation | About 95% within the range |
The first recalculates both its centre and its width on every bar, and draws on only a 20-period sample. The second treats a long run of returns as one fixed distribution. The two numbers are not comparable, and they do not contradict each other.
The Breakdown Is at ±3σ, Not ±2σ
Returning to the distribution side, there is a widely repeated claim here that needs correcting. Across roughly thirty years of daily US equity returns, about 4.5% of days fell outside ±2σ — very close to the 4.55% the normal distribution predicts.
Across mature equity markets, the empirical share outside ±2σ on daily returns is usually not far from the normal distribution (individual instruments and timeframes will differ, so this shouldn't be generalised too broadly).
Where it genuinely breaks down is further out. Days beyond ±3σ occur roughly five times more often than theory predicts. At the same time, the share of days landing inside ±1σ (about 79%) is clearly higher than the theoretical 68%.
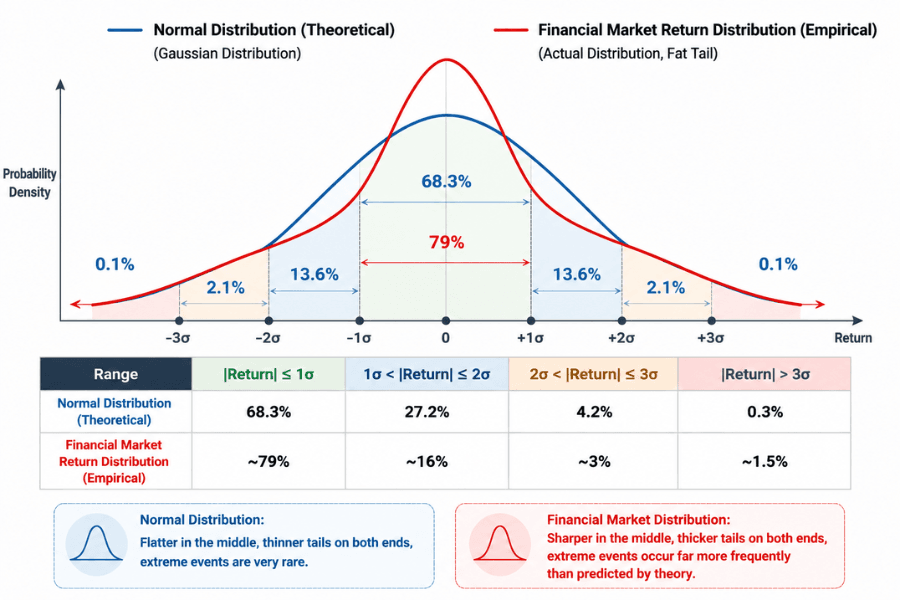
Put those two together and the shape of the market's distribution is more peaked in the middle, thicker at both ends, and thinner through the shoulders in between. Most of the time it is calmer than a normal distribution; occasionally it is far more violent. The days that cause serious damage are precisely the ones that, in theory, should almost never happen.
It is also worth adding that as the observation window lengthens — from daily to weekly to monthly — the return distribution moves closer to normal. The fat-tail problem is therefore at its worst on short timeframes, which is exactly where most retail traders operate.
5. Using the Standard Deviation Indicator (StdDev) in MT4/MT5
Where to Find It and Its Default Settings
Both MT4 and MT5 ship with a standard deviation indicator (shown on the chart as StdDev). To add it, go to the menu bar and select "Insert" → "Indicators" → "Trend" → "Standard Deviation". You can reach the same place from the Navigator by selecting "Indicators" → "Trend". The menu path is identical in MT4 and MT5; the screenshot below shows MT5.
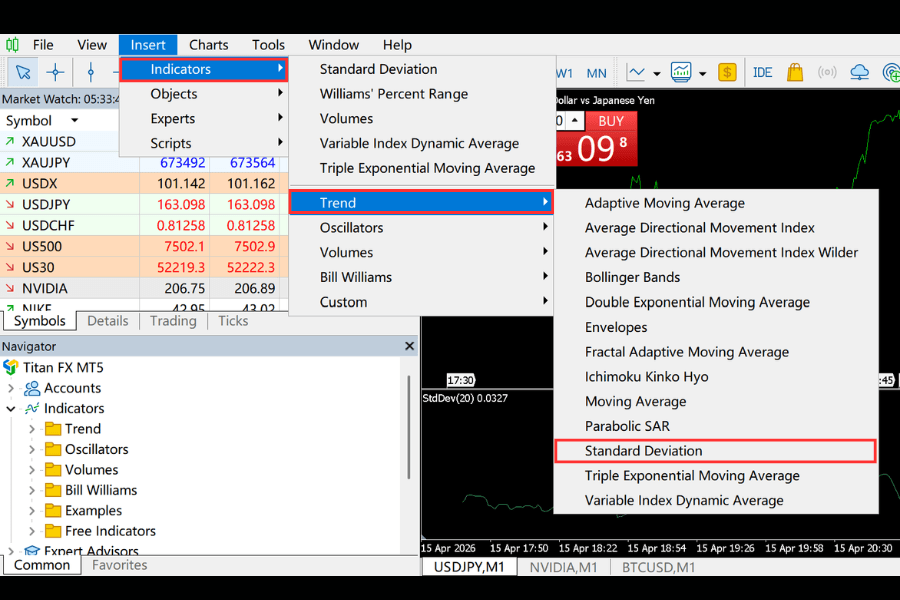
There is one thing that trips people up here. Standard deviation measures volatility, yet it sits under "Trend" — a category named for something else entirely — which makes it easy to miss the first time you look. The Navigator uses the same grouping.
Once added, the default period is 20, and the indicator appears in a separate sub-window below the main chart, labelled StdDev(20) in the top-left corner.
How to Read the Line
StdDev is a single line with no directional component. It reflects only the size of the movement:
- Rising: volatility is expanding and the market is becoming more active.
- Low and flat: the market is consolidating, often the build-up to a subsequent breakout.
- Rising sharply off a low base: frequently accompanies a breakout and can serve as confirmation.
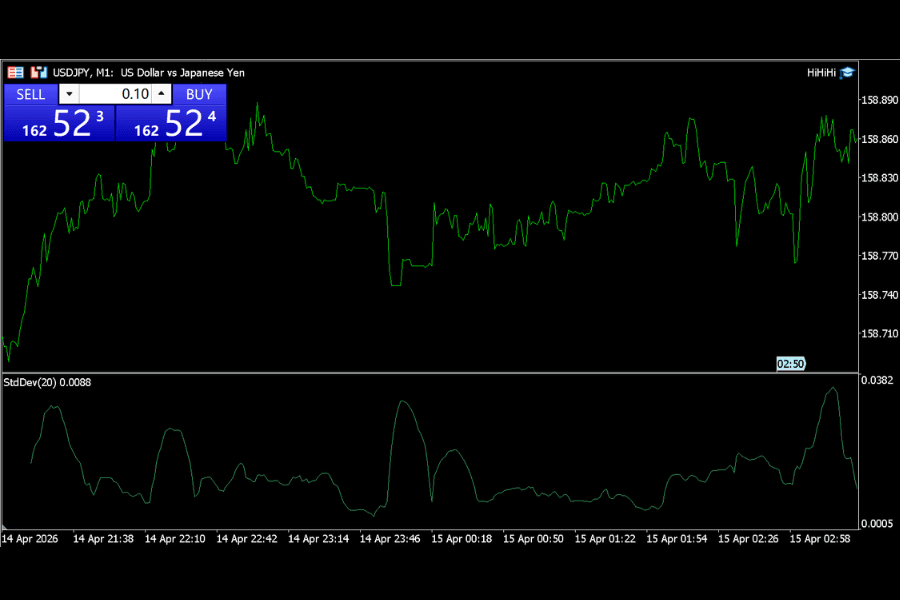
Because it says nothing about direction, it is usually paired with a moving average or a trend-following indicator, and used to check whether a breakout has real force behind it.
One thing to keep separate: MT5 also offers a "Standard Deviation Channel", which is a drawing object plotted around a linear regression line. That is a different tool from the StdDev indicator discussed here.
6. Standard Deviation vs Bollinger Bands vs ATR
All three measure volatility, but they draw on different inputs and present it differently, so each suits a different job.
| Tool | Calculated from | How it displays | Question it answers |
|---|---|---|---|
| Standard deviation (StdDev) | Deviation of closes from the moving average | A single line in a sub-window | Is current volatility high or low? |
| Bollinger Bands | The same, mapped back onto price | Bands on the main chart | Where is price within its normal range? |
| ATR | True range, including gaps | A single line in a sub-window | How far does an average candle travel? |
In one sentence: standard deviation measures how dispersed price is, ATR measures the average range of a single candle, and Bollinger Bands project standard deviation back onto the price axis.
The key difference is that standard deviation looks only at closing prices, so it ignores intraday highs and lows as well as gaps, whereas ATR incorporates gaps. In markets that open with frequent gaps, ATR therefore reflects real risk more faithfully.
If the goal is setting a stop distance, ATR is usually the more practical choice; if the goal is judging the volatility regime or working alongside Bollinger Bands, standard deviation is more direct.
7. In Practice: Setting Stops and Position Size with σ
Using σ to Set the Stop Distance
A fixed-pip stop loss has a structural problem: it is too wide when the market is quiet and too tight when volatility expands, so ordinary movement stops you out.
Basing it on standard deviation avoids that. A common approach is to place the stop 1.5 to 2 σ away from the entry price — the stop widens automatically as volatility expands and tightens as it contracts, staying in step with the market's current rhythm.
| Fixed-pip stop | σ-based stop | |
|---|---|---|
| Stop distance | A fixed value, e.g. 50 pips | Varies with volatility, e.g. 2σ |
| Quiet markets | Relatively too wide; risk-reward suffers | Tightens automatically |
| Volatile markets | Relatively too tight; easily stopped out | Widens automatically |
| Position size | Roughly the same each time | Smaller as volatility rises |
Working Back to Position Size
Once the stop distance is set, position size follows from your risk limit:
Position size = risk you're willing to take ÷ stop distance
Say you're prepared to risk 1% of the account on a trade, and the current daily σ on gold translates to a stop 20 dollars away. Position size is then "1% of capital ÷ 20 dollars".
The point of doing it this way is that the more volatile the market, the smaller the position becomes automatically. Risk exposure stays consistent across trades, and you avoid carrying your largest position into the most violent conditions.
The Same Logic Works on Shorter Timeframes
Most material only demonstrates annualising the daily standard deviation, but the same logic extends downward. Calculate σ on 15-minute or hourly bars and you get a stop distance matched to a day-trading or short-swing rhythm, rather than inheriting a daily-scale figure.
8. Standard Deviation FAQ
Q1: What is the difference between standard deviation and variance?
Variance is the average of the squared deviations; standard deviation is its square root. They measure the same thing, and the difference is the unit — variance is in the square of the original units, while standard deviation returns to the original units and can therefore be compared directly with price, which is why it is used far more often in practice.
Q2: What counts as a high standard deviation?
There is no universal threshold. Standard deviation is an absolute figure that changes with an instrument's price level and the timeframe, so different instruments can't be compared directly. Judge it against that instrument's own historical range, or annualise first if you want to compare across instruments.
Q3: Why doesn't the figure I calculate in Excel match the chart?
Usually the divisor. Charting platforms use the population standard deviation (dividing by n), while Excel's STDEV.S defaults to the sample version (dividing by n−1). Use STDEV.P to match the platform. Over 20 periods the difference is around 2.6%.
Q4: Can standard deviation tell me which way price will go?
No. It measures only the size of movement and carries no directional information — a rising σ means volatility has expanded, not whether price is heading up or down. Its role is as a volatility filter and a risk yardstick; judging direction requires a trend or momentum indicator alongside it.
9. Summary
Standard deviation is the basis on which volatility is calculated, and the shared raw material behind Bollinger Bands, the Sharpe ratio, and much else. Understanding how it is calculated and how to read it is what makes the logic behind those tools visible.
Two points matter most for traders. First, 68-95-99.7 is a property of the normal distribution rather than a guarantee from the market: ±2σ lines up reasonably well, but conditions beyond ±3σ arrive far more often than theory suggests. Second, the most useful thing standard deviation does is not predict direction — it converts an abstract sense of "how much things are moving" into a concrete stop distance and position size, letting risk control adjust itself to the market's rhythm.
Further Reading
- What Is the Sharpe Ratio?
- What Is the Sortino Ratio?
- 6 Practical Bollinger Bands Trading Strategies
- RSI Indicator: Calculation, Interpretation, and MT4/MT5 Use
- USD/JPY Live Rate
Titan FX Research Team. We cover a broad set of financial instruments — foreign exchange, commodities, equity indices, US equities, and digital assets — producing practical, research-backed educational content for traders.
Primary Sources (by Category)
- Indicator source and platform documentation: Bollinger Bands official site, "Bollinger Band Rules" rule 14 — actual band coverage and the limits of the statistical assumption; MetaQuotes MT4/MT5 documentation — the Standard Deviation indicator's formula and parameters
- Academic research: Cont, R. (2001), "Empirical properties of asset returns" — fat tails, volatility clustering and the tail index; Hull, J. C., Options, Futures, and Other Derivatives, §13.4 — annualising on a trading-day basis; Diebold et al. (1997), "Converting 1-Day Volatility to h-Day Volatility" — the limits of the square-root rule
- Market statistics: distribution of daily, weekly and monthly S&P 500 returns and the frequency of sigma events; Titan FX live rates and charts