

Other Technical Indicators
Pivot Points Explained: Calculation Formula, Reading the Seven Levels, and Intraday Trading
Pivot Points turn the previous period's high, low, and close into the central pivot P plus three resistance levels (R1–R3) and three support levels (S1–S3), all fixed for the whole session — one of the most widely used support and resistance frameworks in intraday trading. Covers the classic formula with a worked example, three common uses, the four main variants, the forex time-zone caveat, and Titan FX's pivot indicator for MT4/MT5.

Alligator Indicator Explained: The Three Lines, Sleep and Wake Signals, and Fractal Entries
The Alligator is Bill Williams' trend-state indicator, built from three shifted smoothed moving averages: the Jaw (13/8), Teeth (8/5), and Lips (5/3). Tangled lines mean a sleeping range, an opening mouth with proper stacking means waking, and a widening gap means the feeding trend phase. Covers the calculation, state reading, the original fractal-breakout pairing, caveats, and MT4/MT5 setup.

Donchian Channel Explained: Calculation, Turtle Breakout Strategy, and the Bollinger Bands Comparison
The Donchian Channel builds its bands from the highest high and lowest low of the past N periods, so a band break marks a new high or low — the core of the Turtle trading rules. Covers the three-line calculation, 20/55 parameters, breakout strategy with N (ATR) risk control, the Bollinger Bands comparison, false-breakout caveats, and MT4/MT5 setup.
On-Balance Volume (OBV) Explained: Calculation, Divergence, and How to Use It in Forex
On-Balance Volume (OBV) accumulates volume by the direction of each close, turning volume into a single line read for confirmation, divergence, and early breakouts against price. Covers the calculation, indicator pairings, forex tick-volume limits, and MT4/MT5 setup.

Williams %R Explained: Formula, Overbought/Oversold Levels & the Stochastic/RSI Comparison
A complete guide to Williams %R — the oscillator that reads the close's position within the recent high-low range on a 0 to -100 scale: the formula, overbought/oversold and midline readings, divergence, its mathematical correspondence to Stochastic's Fast %K, how it differs from RSI, and MT4/MT5 settings.

Fractals Indicator Explained: Formation Rules, Breakout Strategy & Stop-Loss Placement
Fractals is Bill Williams' pattern-marking tool, built into MT4/MT5, which automatically marks swing highs and lows using a five-candle rule. This guide covers the formation rules and confirmation lag, the fractal breakout strategy, anchoring stops and trendlines, pairings with the Alligator and other indicators, and how to filter signals in ranging markets.

Parabolic SAR: How to Read It, Parameter Settings, and Trailing Stops
Parabolic SAR is a trend-following indicator created by J. Welles Wilder that plots dots above or below the candles to show trend direction, with a cross between price and the dots acting as a stop-and-reverse signal. This guide covers its definition and calculation logic, three basic uses, the Step and Maximum parameters, its weakness in ranges and how to combine it with ADX and moving averages, plus MT4/MT5 setup.

Momentum Indicator: Formula, How to Read It, and Divergence
Momentum is an oscillator that measures the speed of price change and tends to lead price at turning points. This guide covers the difference between the textbook difference form (around 0) and the MT4/MT5 ratio form (around 100), three ways to read it, regular and hidden divergence, and its shared basis with RSI, KD, CCI and MACD.

Trendlines: How to Draw Them, Judge Validity, and Confirm Breakouts
A trendline connects consecutive highs or lows to mark the direction and pace of a trend, and doubles as dynamic support and resistance. This guide covers the three decisions to make before drawing, what makes a trendline valid, three ways to filter breaks, trend channels and fan lines, and how to draw and use them in MT4/MT5.
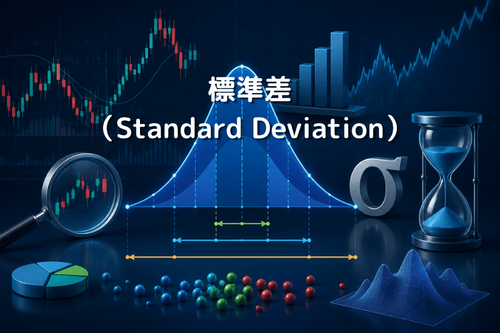
Standard Deviation Explained: Formula, the Limits of the Normal Distribution, and Trading Applications
Standard deviation is the statistical measure of how far price is spread around its mean, and the shared basis for volatility, Bollinger Bands and the Sharpe ratio. This guide covers the formula and the two ways to calculate it, how to read sigma, where the normal-distribution assumption breaks down, the MT4/MT5 StdDev indicator, and how to turn sigma into a stop distance and position size.

Gann Theory