Gann Theory
As traders dig into more advanced technical analysis, "how to use Gann Theory," "how to draw the Gann Fan," and "how to judge turning points with Gann cycles" become common questions.
Gann Theory is an analytical framework that integrates time, price, and geometric proportion, commonly used to forecast market turning points and key support/resistance. By understanding the Gann Fan, the Square of 9, and time cycles, even beginners can gradually build the ability to read the market with "time-space synchronization," bringing additional structure to trading decisions.
- Gann Theory combines three dimensions — price, time, and proportion — arguing that market moves are governed by geometric rules and time cycles together
- The Gann Fan uses the 1x1 line (45°) as a trend watershed: price above it favors bulls, below favors bears
- The Square of 9 derives reversal levels from a numeric spiral, with 90° / 180° / 270° rotations marking the most-watched support and resistance
- Cycle theory emphasizes "time symmetry" and "anniversary" turning points — major highs and lows tend to recur on 30 / 45 / 60 / 90 / 120 / 180-day cycles
- Always combine with candlestick patterns, volume, and moving averages — using Gann alone risks overfitting and false signals
- 1. What Is Gann Theory? The Balance of Price, Time, and Proportion
- 2. Gann Fan Deep Dive: The 1x1 Line and Volatility Settings
- 3. Gann Square of 9: A Numeric-Spiral Price Tool
- 4. Gann Cycle Theory: Time Symmetry and "Anniversary" Turning Points
- 5. Practical: How to Use Gann Theory in Trading
- 6. Technical-Analysis Comparison: Gann, Elliott Wave, and Fibonacci
- 7. Strengths, Limits, and Common Pitfalls of Gann Theory
- 8. FAQ: Real-World Questions About Gann Theory
- 9. Summary: Building a Unified Time-Price Investment Lens
1. What Is Gann Theory? The Balance of Price, Time, and Proportion
Gann Theory was developed by the legendary early-20th-century trader W.D. Gann. Unlike traditional technical indicators, it emphasizes the geometric structure and cyclicality of the market, with three pillars supporting the entire framework.
Gann believed in the "Law of Vibration": every financial instrument — FX, equities, commodity futures — has its own unique vibration frequency. When time and price reach certain geometric symmetry or proportion, trend reversals are most likely to occur.
Pillar 1: Price
Gann focused on support and resistance levels in space — especially key highs and lows. He saw price moves as spiraling outward from particular central points.
Pillar 2: Time
This is where Gann Theory diverges most sharply from other technical analysis. Gann's famous line: "When time is up, price will follow." He believed time determines market reversals, and the weight of the time factor often exceeds that of price itself.
Pillar 3: Proportion
Gann used the geometric proportions of circles (360°), squares, and triangles to subdivide the market. For example, dividing a 360° circle into eighths or thirds to map onto critical price locations.
These three pillars interlock to form the core of Gann Theory. Beginners should first focus on the "correspondence between price and time" — the foundation for later learning on angles and cycles.
2. Gann Fan Deep Dive: The 1x1 Line and Volatility Settings
Gann Fan (or Gann angles) is the most intuitive tool combining time and price. Starting from an important high or low, it draws a set of rays at specific ratios to project future support and resistance.
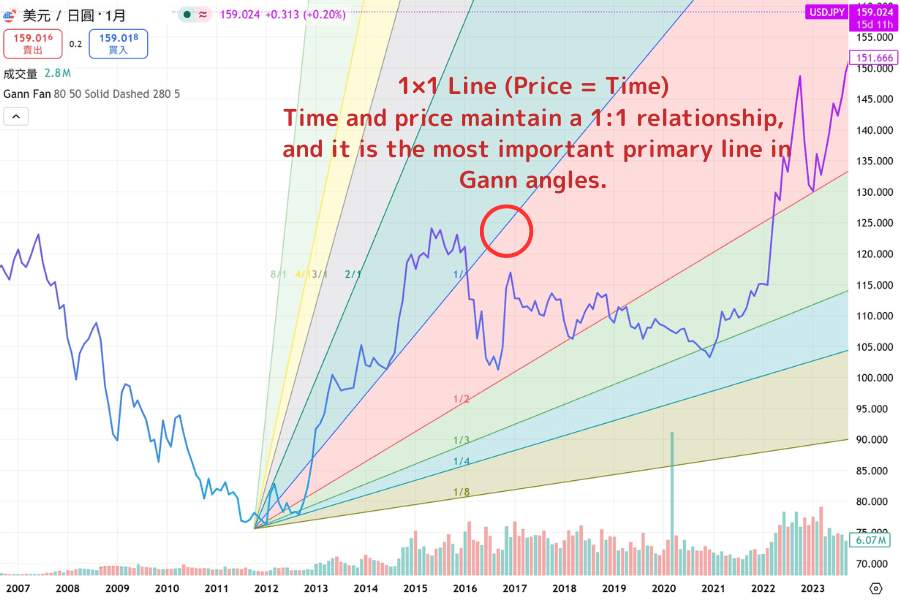
Key Detail: Defining the 1x1 Line
The 1x1 line is the most important line in the Gann Fan, representing "one unit of time = one unit of price." On a chart it doesn't always look like exactly 45° — it depends on your volatility setting (Price/Time).
For instance, setting "1 day = 10 points" makes the software auto-adjust the angle line slopes by that ratio. An incorrect volatility setting will cause the entire fan to diverge from actual price action and lose reference value.
Beginner tip: Start practice with your trading platform's "auto-scaling" or the default 1x1 line, and observe whether price reacts around this line as support or resistance. When price sits above the 1x1 line, bulls are in control. A decisive break below suggests trend weakness.
Note: Arithmetic (linear) and logarithmic (ratio-based) scales can make the angles look different. Beginners should first practice on the chart scale they usually use, then experiment with other settings.
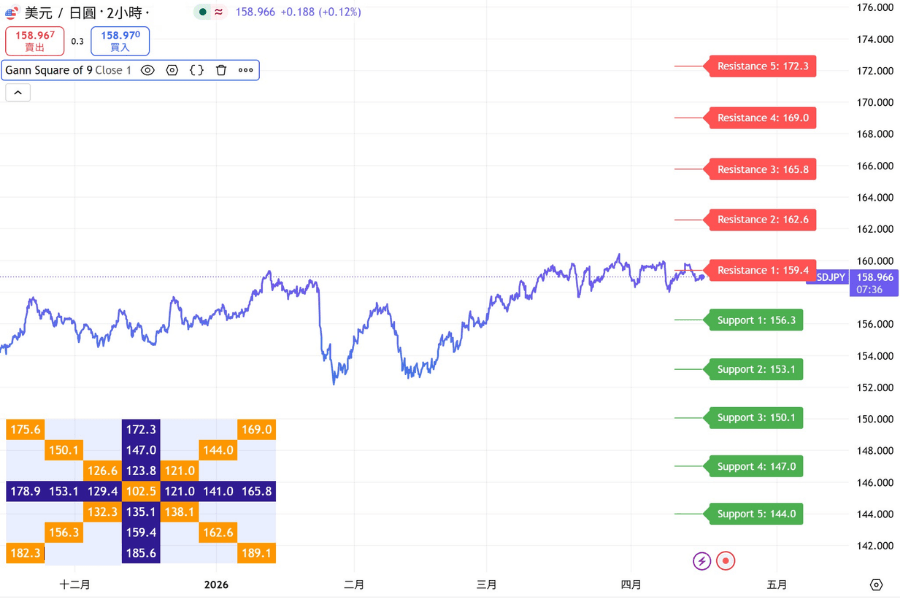
3. Gann Square of 9: A Numeric-Spiral Price Tool
Gann Square of 9 is another key analytical tool in Gann Theory. It arranges numbers in a spiral pattern within a grid to identify important price and time turning points.
Think of the Square of 9 as a "calculator for price and time." Gann believed price moves aren't random — they follow specific mathematical relationships. When price reaches key positions in the Square, obvious support or resistance often appears.
Practical Points:
- Modern trading platforms mostly include the Square of 9. Enter a key anchor price (a recent low or high) and the system marks potential target prices and time cycles automatically.
- The most common use is to locate prices in a "squared" relationship with the anchor — for example, the prices corresponding to 90°, 180°, or 360°. These often become turning points.
Beginners don't need to dive deep into complex calculation. Get familiar with how the software displays these key levels and observe how price actually reacts near them.
4. Gann Cycle Theory: Time Symmetry and "Anniversary" Turning Points
Gann Theory places great emphasis on the time dimension. His famous line: "When time is up, price will follow." He believed market ups and downs aren't random — they follow predictable time cycles. When specific time points arrive, trend reversals become extremely likely.
Common Gann Time Cycles (for Turning-Day Observation)
Gann summarized many time regularities. Traders use these numbers to spot potential "time windows."
- Short cycles: 7 days, 9 days, 13 days. Often used for short-term price surges or pullback reversals.
- Medium cycles: 18 days, 27 days, 52 days (roughly a quarter). Suited to swing traders judging the depth and length of trend corrections.
- Long cycles: 1 year, 7 years, 10 years. The "7-year rule" and "10-year cycle" are considered key references for major structural market cycles.
Key Concept: Time Symmetry
Gann particularly emphasized "time symmetry," which is often the most practically valuable part of cycle theory.
- Turning-point anniversaries: Major rally or drop start dates in history tend to produce similar reversals on the same day or nearby in later years. It's as if the market "commemorates" past important days.
- History repeats: If the previous up-wave ran 30 days, and the next correction approaches 30 days, that's a highly alert "symmetry point."
Beginner practical advice: You don't need to memorize every complex number. Start observing 7-day, 9-day, 18-day, and 1-year cycles first. Mark "anniversaries of major highs and lows" on your chart. When price approaches those time points and simultaneously touches a Gann Fan support or resistance, this "time-space resonance" location usually offers the highest-probability entry or exit.
Note: Gann Cycle Theory is a judgment aid, not an absolute prediction. The market always has variables. Treat time cycles as "probabilistic early warnings" and you'll notice trend changes earlier than most.
5. Practical: How to Use Gann Theory in Trading
The value of Gann Theory lies not in precise prediction but in providing an analytical framework that integrates time and price. Here is a practical flow for beginners — start with the basic angles and gradually add time cycles.
Practical Steps
1. Anchor an important starting point
Find a recent high or low of a clear trend on the chart. This is the anchor for the Gann Fan.
2. Draw the core angle set
Use the 1x1 line as the main axis (1:1 time-price relation). Let the platform's volatility setting draw the angle group. While price runs along the 1x1 line, the trend is typically stable.
3. Look for time-price resonance points
When price approaches a key angle and time hits an important Gann cycle turning day (7, 9, 18 days or 1-year), you have a higher-probability entry or exit signal.
4. Set clear stop-loss and take-profit
A decisive break of the 1x1 line (close below and unable to reclaim quickly) is a weakness signal — cut losses. Take-profit can be set at the next key angle or a time-cycle target price.
Beginner Practical Reminders
- Don't chase perfect prediction at first. Start by using the 1x1 line as dynamic support in an uptrend.
- Gann Theory works best as an aid. Combine with candlestick patterns, volume, or moving averages instead of relying on it alone.
- Enforce risk management strictly — keep per-trade risk to 1-2% of total capital.
Repeat practice until you can feel the edge Gann Theory offers at time-price resonance moments.
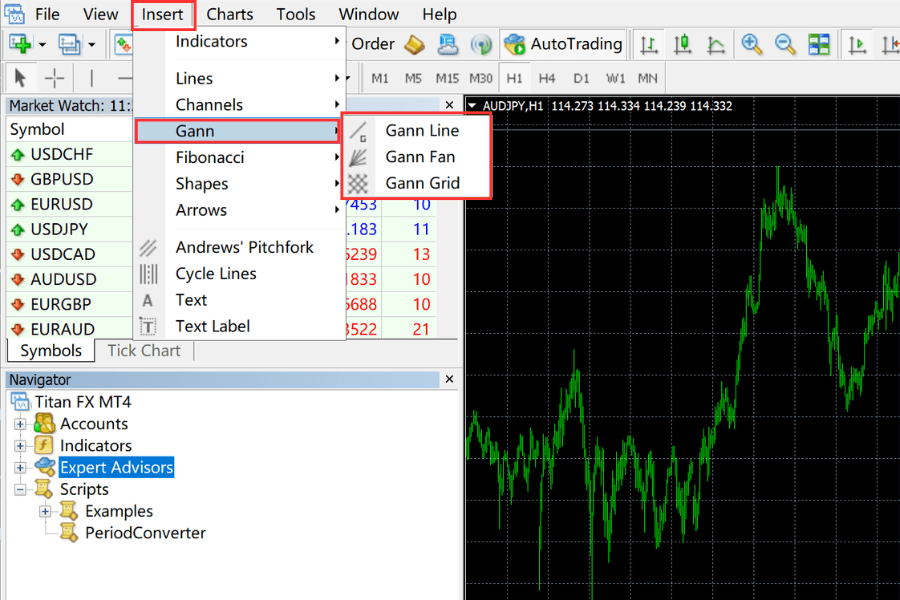
Setting Up Gann Theory in MT4 / MT5
Drawing Gann Tools in MT4
-
Log in to MT4.
-
Click the nav bar: "Insert" → "Gann."
-
Choose: "Gann Line" → "Gann Fan" → "Gann Grid."
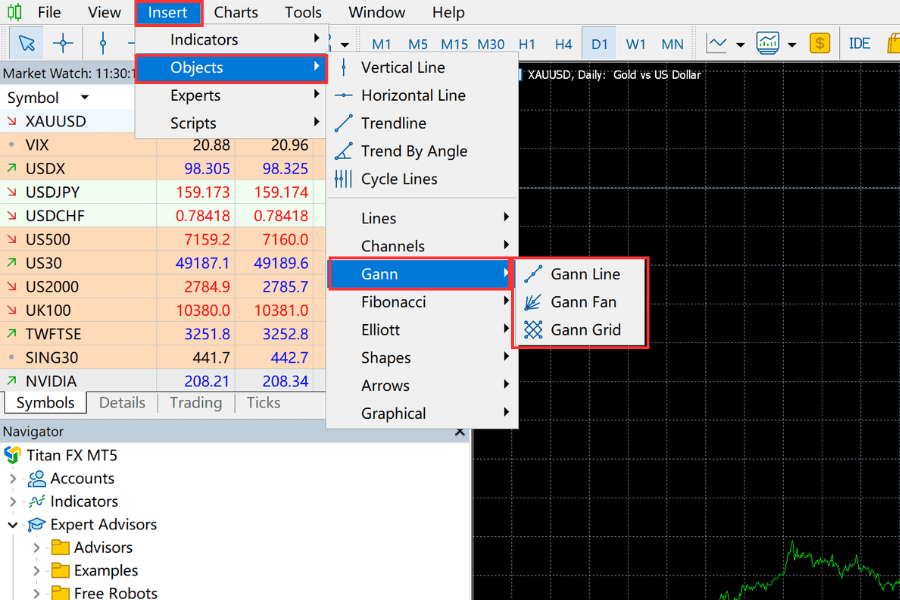
Drawing Gann Tools in MT5
-
Log in to MT5.
-
Click the nav bar: "Insert" → "Objects" → "Gann."
-
Choose: "Gann Line" → "Gann Fan" → "Gann Grid."
6. Technical-Analysis Comparison: Gann, Elliott Wave, and Fibonacci
When learning technical analysis, many beginners encounter Gann Theory, Elliott Wave, and Fibonacci (Golden Ratio) together. All three forecast price, but their starting points differ significantly. The table below helps you find the right tool for your style.
| Tool | Core Logic | Primary Focus | Best Use Case |
|---|---|---|---|
| Gann Theory | Mathematical geometry, time balance | Symmetry of time and price | Forecast future time-based turning points; identify dynamic angle support |
| Elliott Wave | Market psychology and crowd sentiment | The structural pattern of price waves | Judge which stage of the larger trend you're in |
| Fibonacci | Golden-ratio proportions | The magnitude of price retracements and extensions | Find precise static support/resistance prices |
| Traditional Indicators | Statistics and momentum | Overbought/oversold price states | Short-term entry/exit confirmation and trend-strength reads (KD, RSI) |
7. Strengths, Limits, and Common Pitfalls of Gann Theory
Gann Theory has a unique time-price analytical framework, but like any technical approach it isn't flawless. Understanding both sides helps beginners use the tool more rationally.
Main Strengths
- Forward-looking time dimension: Gann Theory considers time and price simultaneously, letting traders anticipate potential turning points before key time cycles arrive — something many traditional indicators can't do.
- Clear support/resistance references: Fan lines and squares produce concrete price zones, giving beginners clearer entry/exit anchors.
Limits and Common Pitfalls
- High subjectivity in settings: Angle slopes depend on the volatility setting. Different software or different users can produce meaningfully different angles, leading to inconsistent judgments.
- Over-reliance on prediction: The most common beginner mistake is treating Gann lines as "what will definitely happen," ignoring real-time volume-price confirmation and the broader market. If an unexpected event hits, pure reliance on angles easily misfires.
- Steep learning curve: Mastering the combination of time cycles and angles takes sustained practice. Beginners often give up because short-term results feel underwhelming.
8. FAQ: Real-World Questions About Gann Theory
Q1: What does a break of the 1x1 Gann line mean?
Usually, the existing trend balance is breaking. In an uptrend, a decisive break of the 1x1 line (close below, unable to reclaim) is often a signal of trend weakness or an impending range. Wait for other confirmation signals before adjusting positions.
Q2: Is Gann Theory better for day trading or longer-term?
Best suited to swing and medium-to-long-term. Angles can work on short time frames, but the time-cycle and proportion characteristics usually show more stability on daily and weekly charts. Beginners should practice on longer timeframes first.
Q3: Do I need deep math to use Gann Theory?
No. Modern trading software (TradingView, MT4/MT5) has Gann Fan and Square tools built in. Understanding the basic logic and correct volatility settings is enough to get started. Focus on observing how price interacts with the angles instead of chasing precise forecasts.
Q4: How accurate is Gann Theory? Can it be used alone?
Accuracy depends on the user's experience and market environment. It isn't a universal forecasting tool — use it as an auxiliary indicator alongside candlestick patterns, volume, or moving averages to lift the overall win rate.
9. Summary: Building a Unified Time-Price Investment Lens
Gann Theory provides an observation method different from traditional technical analysis, integrating price, time, and proportion into one coherent framework. By judging trends with angles, watching turning points through cycles, and aiding price location with the Square, investors can evolve from looking at price alone to "analyzing time and price in sync."
In real trading, start with simple tools — observe support and resistance around the 1x1 line — and gradually layer in time-cycle judgments. When price approaches a key angle at the same time as a meaningful cycle point, this time-space overlap is usually worth extra attention.
Gann Theory doesn't aim for precise prediction — it offers a more structured way to judge. With continued practice and the addition of other technical analysis tools, overall trading decisions become more stable, and long-term consistency improves step by step.
Further Reading
- Elliott Wave Theory — A time/structure school of analysis that pairs naturally with Gann's framework
- Moving Average — Trend-confirmation basics; reads especially well alongside the 1x1 line
- MACD — Momentum and divergence, sharpening cycle-turn timing
- Bollinger Bands — Volatility envelope for support/resistance, complementary to the Gann Fan
- Candlestick Charts — Local reversal cues that help validate Gann angle/cycle alignment
- Reversal Patterns — Head & Shoulders, double-tops and similar setups; combine with Gann cycles for higher conviction
The financial markets research team at Titan FX. Produces educational content for investors across a broad range of asset classes, including foreign exchange (FX), commodities (crude oil, precious metals, agricultural products), stock indices, US equities, and cryptocurrencies.
Primary Sources by Category
- Original works and classic references: W.D. Gann (1923) Truth of the Stock Tape; W.D. Gann (1942) How to Make Profits in Commodities; W.D. Gann (1949) 45 Years in Wall Street
- Exchanges and analytical platforms: TradingView Gann Tools official documentation; CME Group — Commodity Research; Investopedia Gann Theory educational article
- Research, media and reference sources: Bloomberg, Reuters, Financial Times; Technical Analysis of Stocks & Commodities journal; John J. Murphy Technical Analysis of the Financial Markets