Elliott Wave Theory: Complete Beginner's Guide with MT4/MT5 Charting Techniques

Elliott Wave Theory holds that markets move in repeating cycles of five impulse waves and three corrective waves, using the price patterns created by crowd psychology to read trend direction and turning points.
Elliott Wave Theory, developed by Ralph Nelson Elliott, is a classic tool in technical analysis. It identifies market cycle patterns through 5 impulse waves and 3 corrective waves, helping traders predict price movements.
This article explains the theory's core concepts, practical applications, and MT4/MT5 wave analysis setup to enhance your trading strategy.
- 5+3 structure: One full cycle is built from 5 trend-following impulse waves and 3 counter-trend corrective waves
- Three absolute rules: Wave 3 is never the shortest; Wave 2 cannot retrace beyond the start of Wave 1; Wave 4 cannot fall below the high of Wave 1 — break any rule and the count is invalid
- Stronger reads: Combining Fibonacci Retracement, RSI, and ZigZag indicators significantly reduces subjective miscounts
- MT4/MT5 implementation: ZigZag and ZigzagColor automatically mark turning points and accelerate wave counting
- 1. What is Elliott Wave Theory?
- 2. The Core of Elliott Waves: 5 Impulse Waves & 3 Corrective Waves
- 3. Analyzing Elliott Waves with Real Charts
- 4. Elliott Wave Theory: Extension Waves
- 5. Enhancing Elliott Wave Theory: Combining with Common Technical Tools
- 6. How to Set Up Elliott Wave Theory in MT4/MT5
- 7. Free Custom Indicators for MT4/MT5 (Provided by Titan FX)
- 8. Elliott Wave Theory FAQ
- 9. Conclusion
1. What is Elliott Wave Theory?
Elliott Wave Theory was proposed by American economist and philosopher Ralph Nelson Elliott, and has since become a classic market analysis framework.
Elliott believed that market fluctuations are not random but follow a fixed pattern and cycle, much like the waves in nature, exhibiting cyclical movements.
The Elliott Wave consists of 5 impulse waves (advancing waves) and 3 corrective waves, a theory that not only reveals the inherent rules of the market but also serves as an important basis for countless traders to predict market directions.
2. The Core of Elliott Waves: 5 Impulse Waves & 3 Corrective Waves
The essence of the Elliott Wave Theory lies in the structure of "5 impulse waves" and "3 corrective waves":
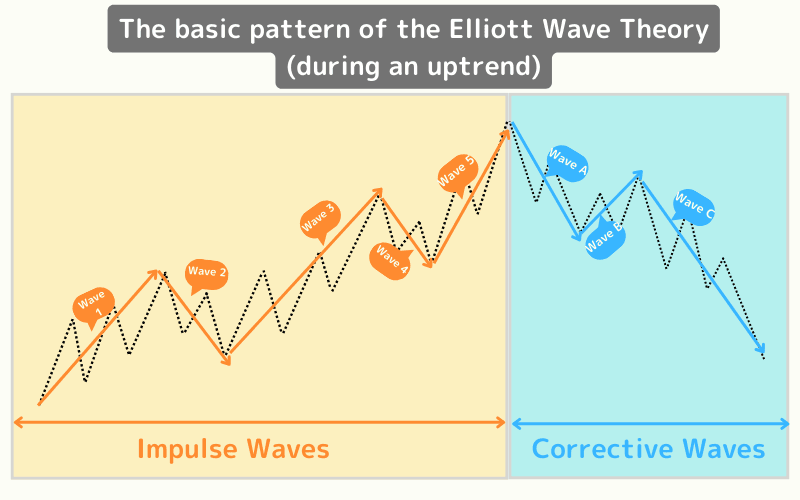
When the market is in an uptrend, it will exhibit 5 upward waves, followed by 3 downward waves for correction.
Conversely, when the market is in a downtrend, 5 downward waves will appear, followed by 3 upward waves as a rebound.
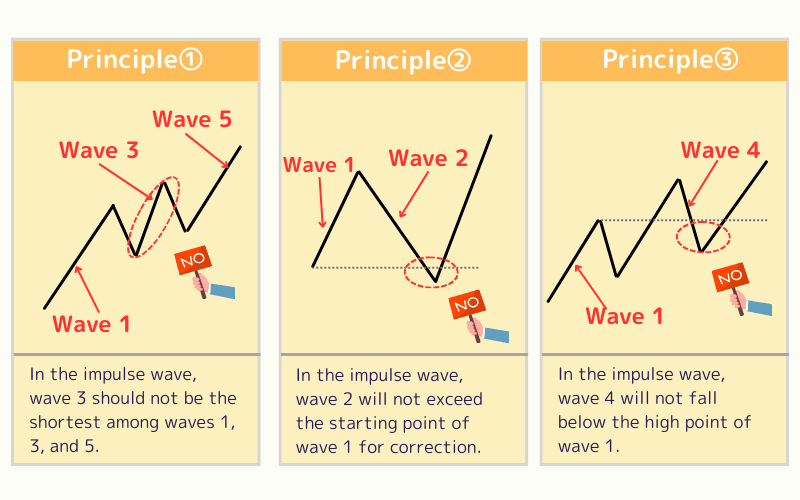
The Three Key Principles of Impulse Waves in the Elliott Wave Theory
The impulse wave in the Elliott Wave Theory follows these three key principles:
| Principle | Description |
|---|---|
| Principle ① | In the impulse wave, wave 3 should not be the shortest among waves 1, 3, and 5. |
| Principle ② | In the impulse wave, wave 2 will not exceed the starting point of wave 1 for correction. |
| Principle ③ | In the impulse wave, wave 4 will not fall below the high point of wave 1. |
As long as the above principles are followed, the Elliott Wave Theory can be valid and help predict the subsequent corrective waves. For the standard definition and additional rule details, see Investopedia: Elliott Wave Theory.
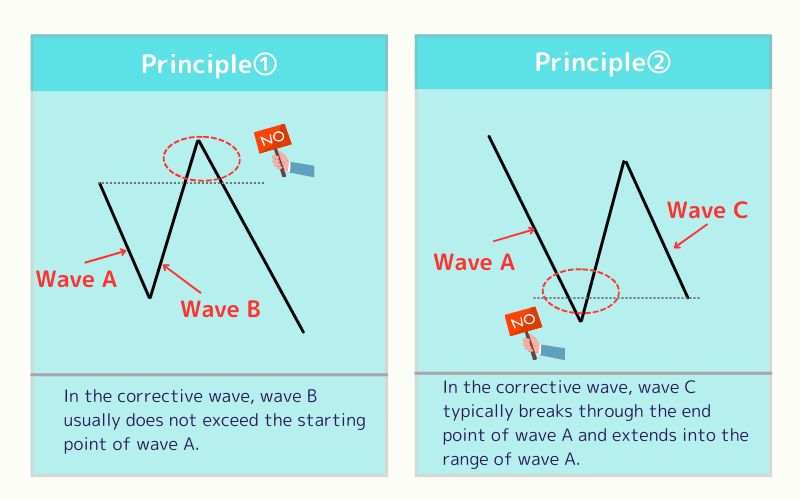
The Two Key Principles of Corrective Waves in the Elliott Wave Theory
The corrective wave in the Elliott Wave Theory follows these two key principles:
| Principle | Description |
|---|---|
| Principle ① | In the corrective wave, wave B usually does not exceed the starting point of wave A. |
| Principle ② | In the corrective wave, wave C typically breaks through the end point of wave A and extends into the range of wave A. |
However, these principles are general guidelines, and in the actual market, flexibility is needed.
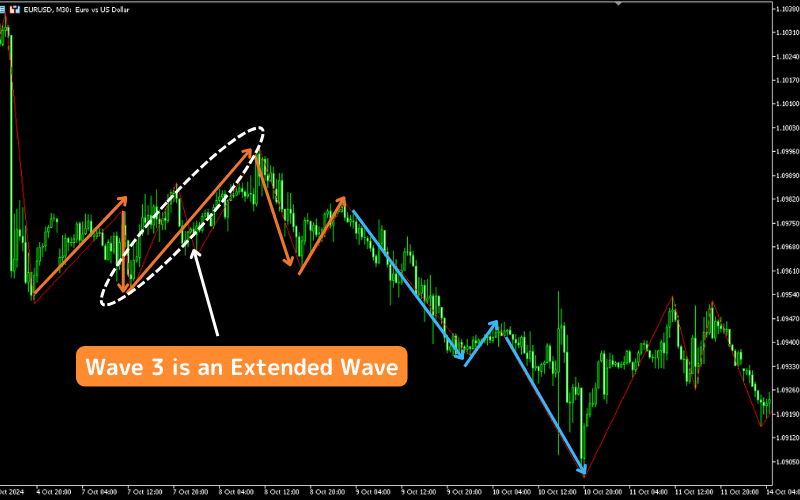
3. Analyzing Elliott Waves with Real Charts
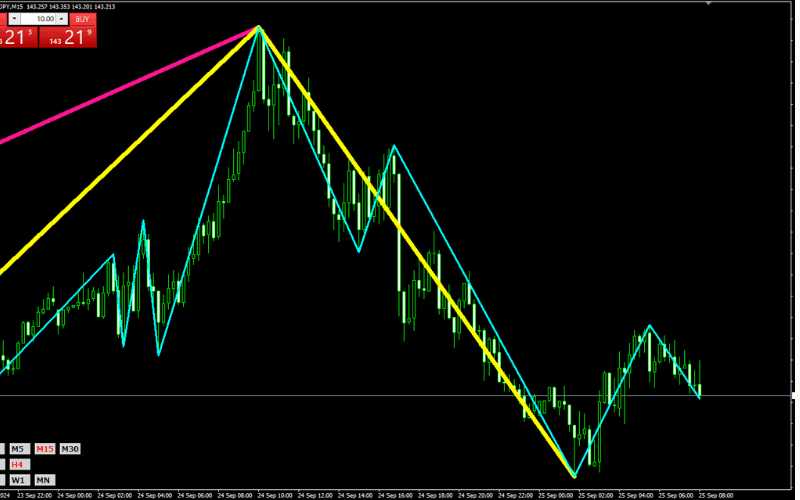
Below is a 30-minute chart of EUR/USD on MT5, clearly showing the structure of the Elliott Wave.
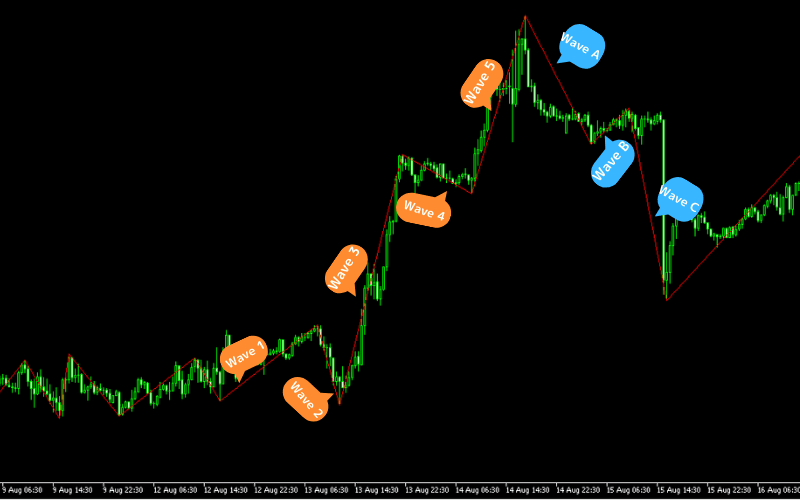
Although this is a post-analysis, if you are able to identify the impulse wave (5 upward waves) in advance, you can look for sell opportunities during the subsequent corrective wave (3 downward waves).
4. Elliott Wave Theory: Extension Waves
When the market follows the basic rules of the Elliott Wave Theory and there is a significant increase in price fluctuations and trading volume, extension waves may occur.
Extension waves will only appear once in a complete 5-wave structure, and typically occur in the main upward phase (wave 3).
Although termed as "extension waves," they still belong to the original 5-wave structure and do not truly "extend" out, ultimately forming a complete wave cycle.
Key Characteristics of Extension Waves
| Characteristic | Description |
|---|---|
| Occurrence | Extension waves typically occur in wave 1, 3, or 5, but only in one of these waves. The most common occurrence is in wave 3, as wave 3 is usually the strongest wave in the trend. |
| Market Meaning | When an extension wave appears, it indicates a very strong market trend, with the trend likely to last longer. Extension waves are usually accompanied by a significant rise in stock prices and a sharp increase in trading volume, further confirming the strength of the trend. |
| Technical Features | Extension waves themselves are also a complete 5-wave structure, in line with the basic rules of the Elliott Wave Theory. The appearance of an extension wave does not disrupt the original wave structure, but rather makes the trend more evident and prolonged. |
5. Enhancing Elliott Wave Theory: Combining with Common Technical Tools
Elliott Wave Theory is a powerful market analysis tool, but to improve its accuracy and practicality, it is often combined with other technical indicators and tools. Here are some commonly used complementary tools:
5.1. Elliott Wave Theory and Fibonacci Retracement
In the 30-minute chart of EUR/USD, we can clearly observe the development of wave 3, and draw the Fibonacci Retracement along this wave to further analyze the market's fluctuation structure.
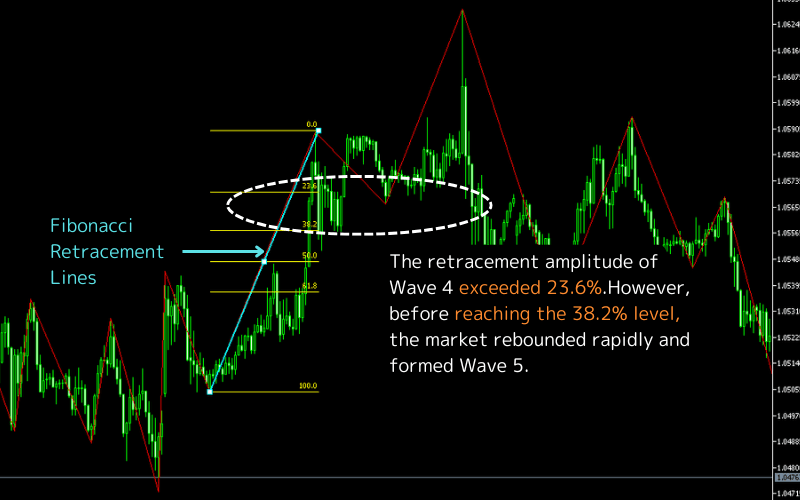
Subsequent movements show that the retracement of wave 4 broke through the 23.6% retracement level, but quickly rebounded before reaching the 38.2% level, indicating strong support and providing valuable entry opportunities for traders. For the canonical definition of golden-ratio retracement levels, see Wikipedia: Fibonacci Retracement.
5.2. Elliott Wave Theory and RSI (Relative Strength Index)
In the 30-minute chart of EUR/USD, combining Elliott Wave Theory with the RSI (Relative Strength Index) reveals that when the impulse or corrective wave reverses, the RSI indicator typically approaches the overbought region (usually above 70) or oversold region (usually below 30).
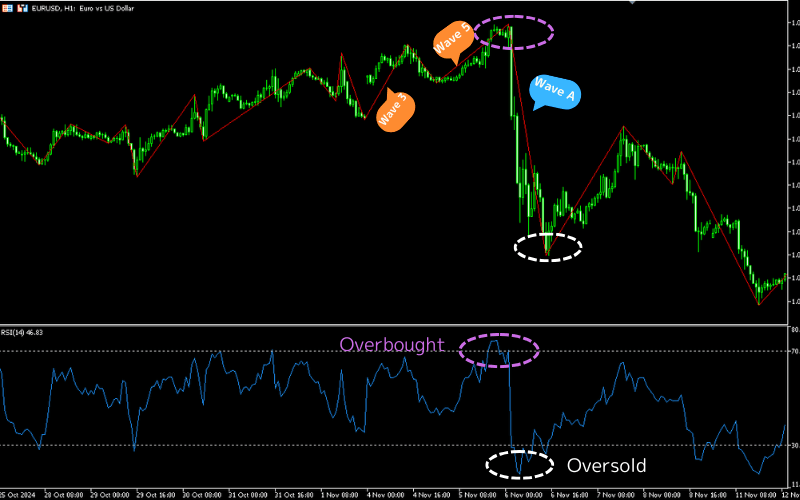
This provides traders with additional confirmation signals, helping to identify potential turning points and optimal entry/exit opportunities. For broader momentum-indicator coverage and professional certification material, see the CMT Association official resources.
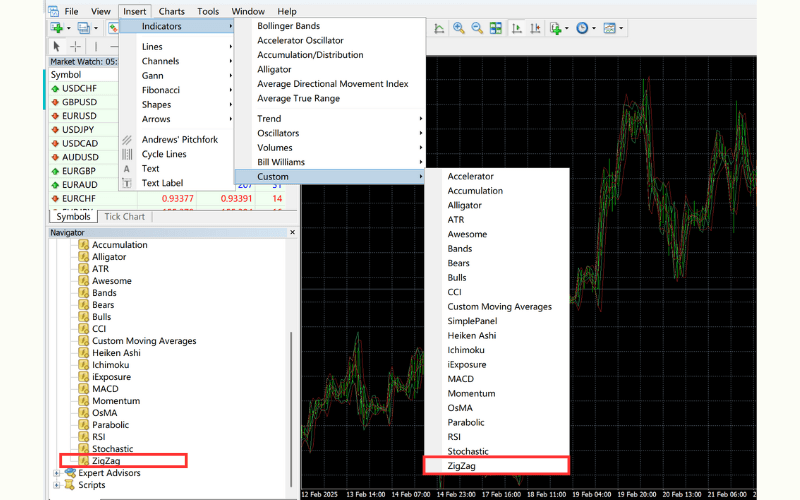
6. How to Set Up Elliott Wave Theory in MT4/MT5
You can set up the Elliott Wave Theory on MT4 or MT5 by following these steps:
How to Draw the Elliott Wave Theory on MT4
① Log in to MT4
② Open the chart for the trading pair
③ Click on the "Insert" menu - "Custom" - "Zigzag"; or in the Navigator bar, select "Indicators", then choose "Zigzag".
How to Draw the Elliott Wave Theory on MT5
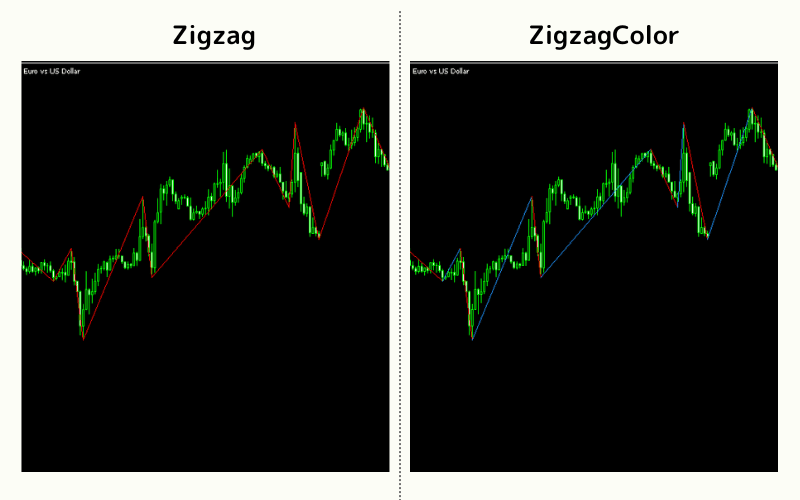
In MT5, in addition to the traditional "Zigzag" indicator, a new "ZigzagColor" indicator has been added. This indicator automatically differentiates the color based on the market's rise or fall, providing a more intuitive visual effect for your wave analysis.
The steps to add both indicators are as follows:
① Log in to MT5
② Open the chart for the trading pair
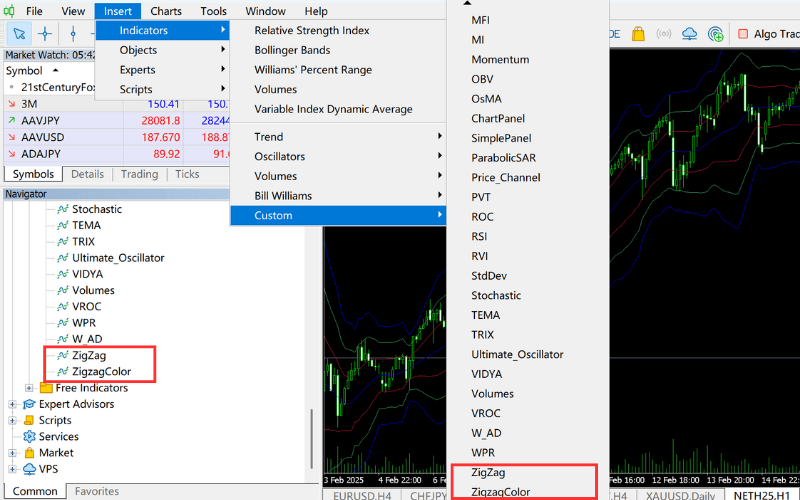
③ Click on the "Insert" menu - "Indicators" - "Custom" - "Zigzag or ZigzagColor"; or in the Navigator bar, click on "Indicators" - "Examples" - "Zigzag or ZigzagColor".
7. Free Custom Indicators for MT4/MT5 (Provided by Titan FX)
Titan FX offers several free MT4/MT5 custom indicators to help traders optimize strategies and improve decision-making accuracy. Simply register for a free account to download and use these indicators, which are simple and convenient.
1. Multi-Timeframe ZigZag Indicator (Titan_Set_Timeframe_ZigZag)
This indicator is an enhanced version of the "ZigZag" and displays the market trend across multiple timeframes, automatically changing colors based on the rise or fall.
It helps traders clearly understand short-term, medium-term, and long-term trend states, enabling more accurate trading decisions.
Further reading: Titan_Set_Timeframe_ZigZag Indicator Description and Installation Guide
2. ZigZag Trend Line Indicator (Titan_ZigZag_Trend)
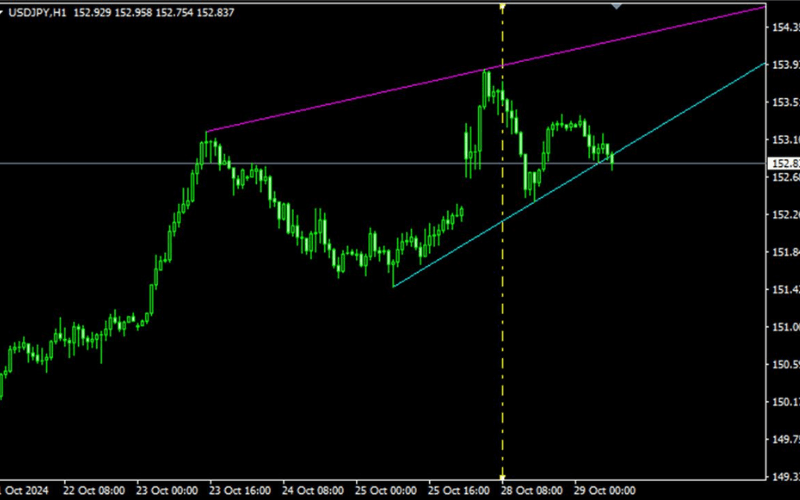
This indicator connects multiple high and low points of the ZigZag pattern on MT4 and MT5, automatically drawing trend lines. Trend lines are useful for determining market direction and reversal points.
By using this indicator, traders can save time on manual line drawing and more efficiently confirm trend lines.
Further reading: Titan_ZigZag_Trend Indicator Description and Installation Guide
8. Elliott Wave Theory FAQ (Frequently Asked Questions)
Below are common questions and answers about Elliott Wave Theory.
Q1: Which markets is Elliott Wave Theory suitable for?
Elliott Wave Theory applies to highly volatile financial markets including forex, stocks, indices, futures, and cryptocurrencies. It is effective for both intraday trading and longer-term positioning, where its trend-prediction value can come through.
Q2: How to identify impulse waves and corrective waves?
Impulse waves (5-wave pattern) typically follow the main trend with stronger momentum and clear rhythm; corrective waves (3-wave pattern) represent counter-trend adjustments and are common during ranging or pullback phases. Traders can combine candlestick patterns, trend lines, and Fibonacci Retracement for confirmation.
Q3: What are the limitations of Elliott Wave Theory?
Wave reading is partly subjective, and different traders may label the same chart differently. In addition, in highly volatile markets or those driven by strong news flow, wave forms can deform or break down. We recommend pairing it with other technical tools such as Moving Averages and MACD for additional context.
Q4: How do you confirm the entry timing when wave 3 extends?
Wave 3 is the most powerful leg of the impulse structure and frequently produces extension waves. Three signals confirm a high-probability entry: (1) the wave 2 pullback does not break the start of wave 1 and typically lands in the 50%–61.8% Fibonacci Retracement zone; (2) wave 3 breaks above the wave 1 high with a clear surge in volume; (3) RSI / MACD strengthen alongside price without entering the overbought zone. The recommended approach is to scale into the position once the wave 2 pullback completes and price reclaims the wave 1 high.
Q5: How should you respond when a "Failed Fifth" appears?
A "Failed Fifth" occurs when wave 5 reverses without breaking above the wave 3 high, and is common in the late, momentum-exhaustion phase of a trend. Identification: (1) wave 5 is visibly shorter than wave 3; (2) volume contracts during wave 5; (3) RSI / MACD print a bearish divergence at the top. Response: if wave 5 fails to make a new high and a top divergence is in place, take profit early and prepare for the subsequent A-B-C corrective sequence.
Q6: Why does the golden ratio align so closely with wave structure?
Elliott observed that the Fibonacci sequence is widespread in nature — from the nautilus shell to the arrangement of sunflower seeds — and applied the 0.382 / 0.500 / 0.618 golden-ratio levels to the wave structure: wave 2 frequently retraces 50%–61.8% of wave 1, while wave 4 often rebounds around the 38.2% area. The fit is not coincidence; it reflects the self-similar rhythm produced by the collective "greed–fear" cycle of market participants, and resonates with the ideas of fractal geometry.
9. Conclusion
Elliott Wave Theory remains a cornerstone of technical analysis, revealing market cycle patterns through its 5-impulse-wave and 3-corrective-wave structure to help traders forecast price movements.
This guide has covered the theory's core principles, practical applications, and MT4/MT5 setup methods to assist your forex and stock trading. By combining wave patterns with other technical indicators, traders can significantly enhance decision-making accuracy — making it a valuable methodology worth mastering through practice.
Further Reading
- Head and Shoulders Top & Bottom Patterns
- Bollinger Bands
- Reversal Patterns
- Moving Averages (MA)
- Trend Line Drawing Shortcuts
The Titan FX Financial Markets Research and Analysis Team. Covering forex (FX), commodities (crude oil, precious metals, agricultural products), stock indices, US equities, and crypto assets, the team produces educational content for investors across a broad range of financial instruments.
Primary Sources (by Category)
- Original works: Ralph Nelson Elliott, The Wave Principle (1938); A.J. Frost & Robert R. Prechter Jr., Elliott Wave Principle: Key to Market Behavior
- Education and certification bodies: CMT Association; Elliott Wave International (the authoritative research firm founded by Robert Prechter); Investopedia technical-analysis entries
- Platform documentation: MetaQuotes MT4 / MT5 ZigZag and ZigzagColor built-in indicator references
- Fibonacci background: Leonardo Fibonacci, Liber Abaci (1202), and research on the golden ratio in nature
- Media and research: Bloomberg, Reuters, and the market analyses cited in the article