

Parabolic SAR: How to Read It, Parameter Settings, and Trailing Stops
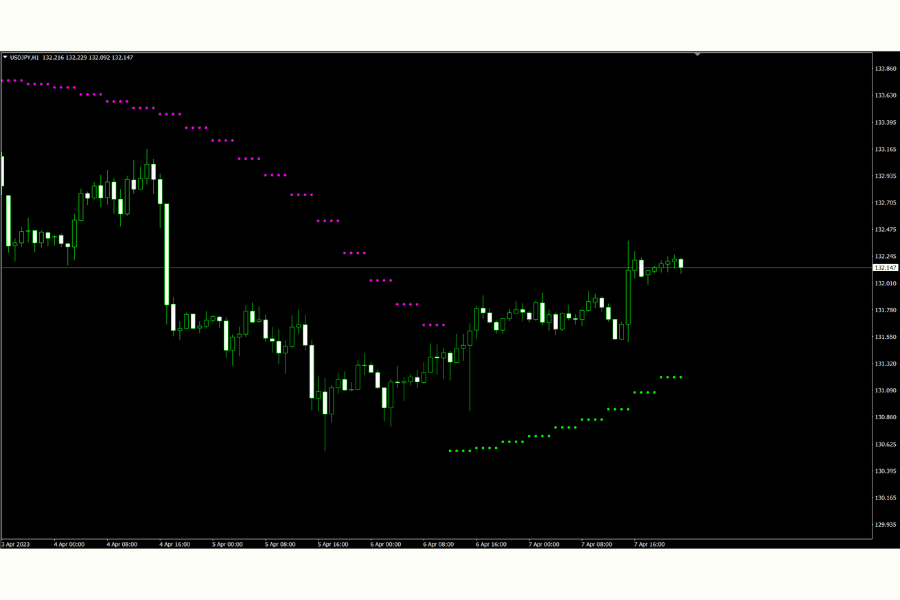
Parabolic SAR (Parabolic Stop And Reverse) is a trend-following indicator created by J. Welles Wilder that plots a series of dots above or below the candles to show the current trend direction. Dots below price signal an uptrend; dots above price signal a downtrend. When price crosses through the dots, the indicator flips to the other side, producing the "Stop And Reverse" signal that gives the tool its name.
Where moving averages and trendlines tell you the direction and slope of a trend, Parabolic SAR answers two very concrete questions: which side you should be on right now — long or short — and where your stop belongs. It compresses both into a single row of moving dots on the chart, which makes it easy to read. That is exactly why so many traders favor it as a dynamic "trailing stop" tool.
This article covers what Parabolic SAR is and how it is calculated, three basic ways to use it, how the Step and Maximum parameters affect it, its weakness in range-bound markets and how to combine it with other tools, and what to watch for when displaying and configuring it in MT4/MT5.
- Parabolic SAR is a trend-following indicator shown as dots: below price means an uptrend, above price means a downtrend.
- The name comes from Stop And Reverse — when price crosses the dots, both the direction and the stop location flip at once.
- The dots accelerate toward price, so the most practical use is as a self-tightening "trailing stop."
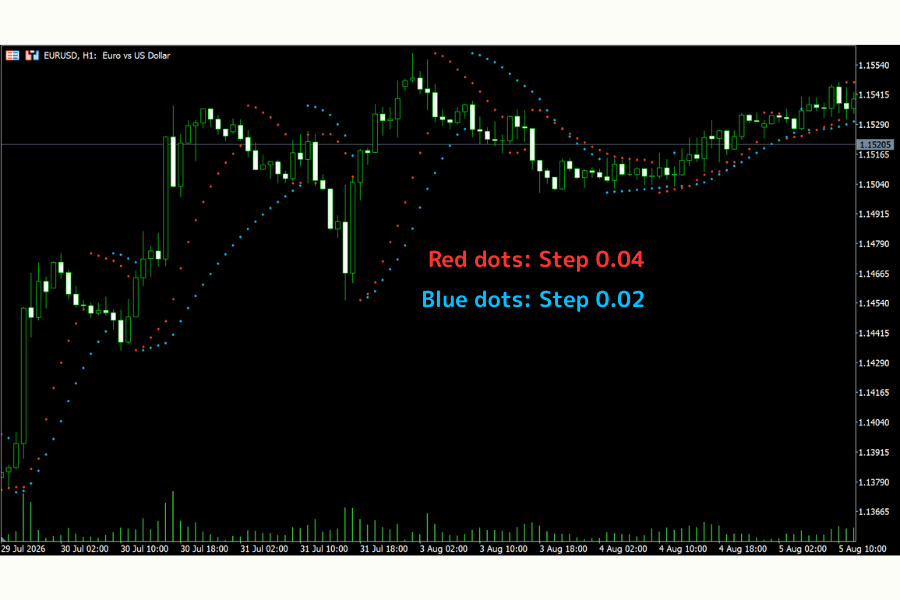
- Two parameters: Step (default 0.02) sets how fast the dots accelerate; Maximum (default 0.2) caps that acceleration. A larger Step is more sensitive but produces more false signals.
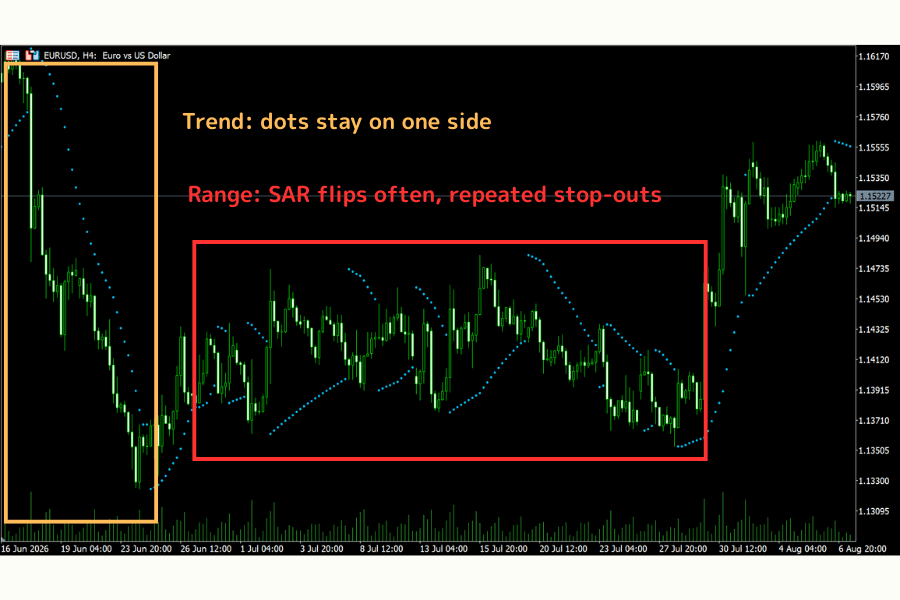
- In range-bound markets Parabolic SAR flips repeatedly and racks up back-and-forth stop-outs, so confirm a trend exists (with ADX/DMI, for example) before relying on it.
1. What Is Parabolic SAR?
Parabolic SAR (full name: Parabolic Time/Price System) was introduced by the technical-analysis pioneer J. Welles Wilder in his 1978 book New Concepts in Technical Trading Systems — the same book that introduced RSI, ADX/DMI, and ATR.
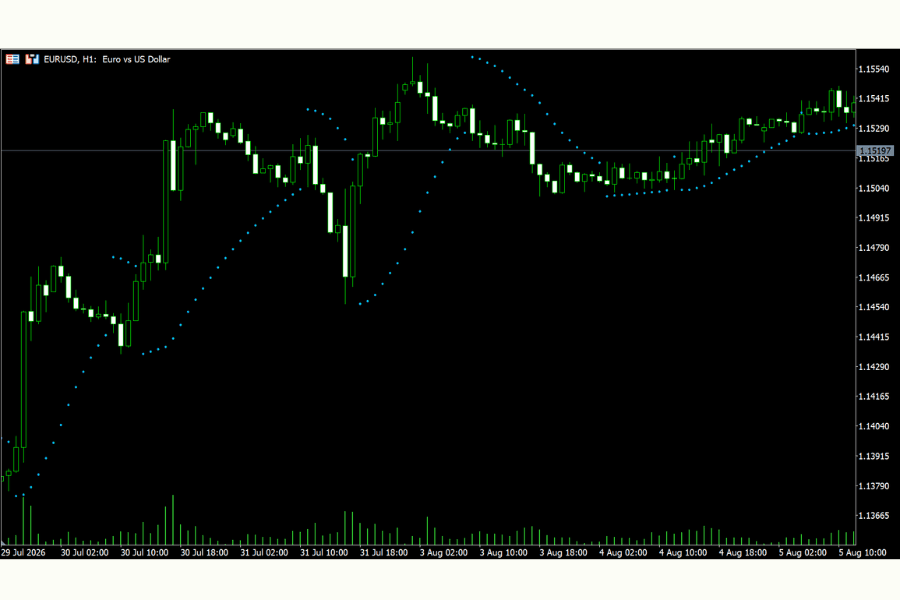
It is also displayed differently from most indicators. While the majority sit in a sub-window, Parabolic SAR is plotted directly on the candlestick chart as a string of dots. The first layer of reading is straightforward: dots below price mean the market is in an uptrend; dots above price mean a downtrend.
SAR stands for Stop And Reverse, which sums up its design philosophy: it assumes the trader is always in a position. In an uptrend you are long, and the dots track along below price, stepping higher. Once price breaks below the dots underneath it, the calculation rules place the next dot above price, forming a stop-and-reverse signal — in theory you close the long here and go short. Whether you actually reverse is up to you; the point is that the cross between price and the dots is its direction-change signal.
The dots have one more key property: as the trend continues, they accelerate toward price, tracing a path that looks like a parabola — which is where the "Parabolic" in the name comes from. The longer a trend runs, the tighter the dots close in, and that is what makes SAR naturally suited to a self-tightening trailing stop.
2. How Parabolic SAR Is Calculated
Parabolic SAR is more complex to calculate than most indicators, but in practice you never need to work it out by hand — understanding why it accelerates is enough. Each dot's position is determined by three elements:
- EP (Extreme Point): the highest high (in an uptrend) or lowest low (in a downtrend) reached during the current trend.
- AF (Acceleration Factor): the "Step" on the platform, starting at 0.02 by default. Each time a new EP is made, the AF increases by 0.02, up to the "Maximum" (0.2 by default).
- The previous bar's SAR value.
Each bar's SAR is derived from the following formula:
What the formula means is that SAR moves a small step toward the EP each bar, and the size of that step is set by the AF. Every time the trend makes a new high (or low), the AF grows a little, so SAR closes in on price faster and faster. That is the source of the "acceleration" and the parabolic path.
On top of that, the actual calculation follows Wilder's rule that SAR may not penetrate the recent price extremes (in an uptrend, for instance, it references the prior few bars' lows). So the final dot position is not determined by the formula above alone.
When price touches SAR and the system reverses, the AF resets to its initial value of 0.02 and the EP resets to the extreme at the moment of the reversal, and the process starts building again in the opposite direction.
3. Three Basic Ways to Use It
Use 1: Read the dot position to judge trend direction
The most basic use is simply to see which side the dots are on. Dots below the candles mean the bias is long — trade with the trend to the upside; dots above mean the bias is short. This makes SAR a directional filter that shows at a glance which side you should be on.
Keep in mind that SAR judges a trend's direction and stop location, not its strength — how far the dots sit from price does not directly measure how strong the trend is. To gauge whether a trend is strong enough, ADX/DMI is the better tool.
Use 2: Read the crosses as reversal signals
When price breaks through the dots and they flip from one side to the other, the SAR system has judged that the trend has reversed and issues a stop-and-reverse signal. This is SAR's clearest entry and exit point — but it is also the source of its false signals, because in a range price crosses the dots repeatedly and they flip again and again.
Use 3: Use it as a trailing stop (most practical)
SAR's most favored use is actually as a trailing stop — a role far more practical than treating it as an entry signal. When you are long, place your stop at the dot below price; as the dots step higher, the stop automatically tightens with them, locking in profit without exiting too early, until price falls back and touches a dot. This approach of "letting the stop follow the trend" is SAR's most robust role in real trading. For the fundamentals of stops, see our guide to the stop loss.
4. The Two Parameters: Step and Maximum
Parabolic SAR has only two parameters, and both relate to "acceleration":
| Parameter | Default | Role |
|---|---|---|
| Step | 0.02 | The AF's starting value and increment; sets how fast SAR closes in on price |
| Maximum | 0.2 | The ceiling on the AF; keeps the dots from snapping onto price too quickly |
You can think of the trade-off this way:
- A larger Step: SAR becomes more sensitive and catches reversals sooner, but in choppy conditions it flips more often and produces more false signals.
- A smaller Step: SAR becomes slower, with fewer false signals and more room on the stop, but it confirms reversals later.
In practice, most traders simply keep Wilder's original settings (0.02 / 0.2). There is no "best parameter," only the one that suits your trading timeframe and the instrument's volatility. Once you settle on it, keep it fixed and observe — don't change it constantly.
5. Weaknesses and How to Combine It
Parabolic SAR's biggest weakness comes from its "always in the market" design: it assumes the market is always trending. So in a range-bound market with no clear direction, price crosses the dots again and again, SAR keeps firing stop-and-reverse signals, and the trader is whipsawed into back-and-forth stop-outs — the single most common source of losses when using SAR.
The key to overcoming this is to rely on SAR only when a trend is present. There are three common combinations:
- Apply a trend-strength filter first: use DMI/ADX to confirm whether a trend exists. A high ADX (above 25, say) means there is a trend and SAR is more reliable; when ADX is low the market is usually ranging, and you should use SAR's cross signals sparingly, if at all.
- Set direction with a trend tool: use a moving average or a trendline to judge the larger direction first, take only the SAR signals that align with it, and ignore the counter-trend reversal signals.
- Confirm across timeframes: check the SAR direction on a higher timeframe first, then enter on a lower one, which filters out a good deal of short-term noise. Note that aligning timeframes only reduces some of the noise — it cannot eliminate false signals entirely. Titan FX's "Multi-Timeframe Parabolic SAR" indicator overlays the higher-timeframe SAR onto your current chart so the multi-timeframe direction is visible at a glance.
6. Displaying Parabolic SAR in MT4/MT5
Parabolic SAR is a built-in indicator in MT4/MT5, so there is nothing to install. From the menu at the top of the chart, select Insert → Indicators → Trend → Parabolic SAR, and the dots are overlaid directly on the candles in the main chart. The menu path is identical in MT4 and MT5; the screenshot below shows MT5.
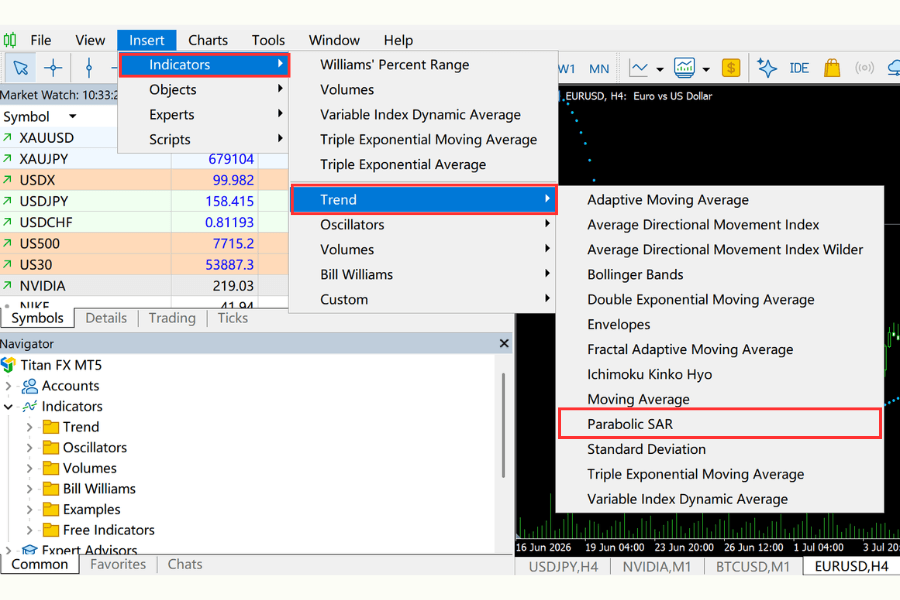
The settings window has just two parameters — Step (default 0.02) and Maximum (default 0.2) — which are exactly Wilder's original settings, so in most cases you can leave them as they are. If you want to adjust them later, right-click a dot on the chart and choose Properties to reconfigure. To browse the full list of indicators the platform offers, see the page below.
All Custom IndicatorsHow to combine it with trend tools and use it as a stop is covered in detail in Sections 3 and 5, so we won't repeat it here. There is just one principle to remember when you use it: use it as a stop when there is a trend, and filter with a tool like ADX first when the market is ranging. That alone helps you avoid the false-signal trap that catches SAR users most often.
7. Parabolic SAR FAQ
Q1: Can Parabolic SAR be used on its own?
Not recommended. SAR's "always in the market" nature makes its false signals especially frequent in a range. In practice you should first confirm a trend exists with a trend-strength tool (such as ADX/DMI), set direction with a moving average or trendline, and then use SAR for with-trend stops and exits. Relying on SAR's cross signals alone to enter and exit tends to produce a string of losses in sideways markets.
Q2: Can Parabolic SAR predict reversals?
No. SAR is a trend-following indicator calculated from price that has already happened; its flip signals mean the existing trend conditions have broken, which is a coincident or slightly lagging confirmation — it cannot tell you in advance what the next move will be. Treating it as a tool for tracking "whether the trend is still intact" fits its nature better than treating it as a leading, predictive tool.
Q3: Is Parabolic SAR suitable for range-bound markets?
No — a range is exactly the environment SAR handles worst. In a narrow range price crosses the dots over and over, so SAR flips constantly, fires a stream of false signals, and produces a series of small stop-outs. When a range sets in, it's better to use something like ADX to judge that the trend is weak and temporarily ease off relying on SAR.
Q4: What should I set Step and Maximum to?
Most traders keep Wilder's original settings (Step 0.02, Maximum 0.2). A larger Step is more sensitive and catches reversals faster but adds false signals; a smaller Step does the reverse. There is no standard answer — match them to your trading timeframe and the instrument's volatility, and once set, keep them fixed and observe.
Q5: How are Parabolic SAR and ADX related?
Both were created by Wilder, and they complement each other well. ADX measures how strong a trend is, while SAR gives you the with-trend entries, exits, and stops. A common approach is to use ADX as a switch — take SAR's signals only when ADX is high, and stay out when ADX is low (ranging) — which effectively reduces the false signals SAR fears most.
Q6: What instruments can Parabolic SAR be used on?
Conceptually it works on anything with continuous prices — forex, stocks, indices, commodities, and crypto all qualify. It measures trend and reversal and is independent of an instrument's price level, so unlike some indicators you don't have to worry about cross-instrument comparison; what really drives its effectiveness is whether that instrument currently has a clear trend.
8. Summary
Parabolic SAR uses a row of moving, accelerating dots to compress two things onto the chart — which side to be on, and where to place your stop — in a way that is intuitive to read and clear in its signals. Its most robust role is as a self-tightening trailing stop; used as an entry signal, it tends to be a step behind.
But its "always in the market" design is a double-edged sword — in a trendless range, SAR flips endlessly and fires a stream of false signals. The key to using it well is to confirm first whether a trend is present: use ADX/DMI as a filter, set direction with a moving average or trendline, and take SAR's exits and stops only when you are trading with the trend.
Understand that role, and Parabolic SAR turns from an easily misused signal generator into a reliable with-trend stop tool.
Further Reading
- RSI Indicator: Calculation, Interpretation, and MT4/MT5 Use
- MACD Indicator Explained: Complete Beginner's Guide with Trading Examples
- Bollinger Bands Complete Guide: Principles, Standard Deviation, Formula, and Plotting
- Ichimoku Kinko Hyo: Principles, Setup, and Trading Strategies
- Momentum Indicator: Formula, How to Read It, and Divergence
Titan FX Research Team. We cover a broad set of financial instruments — foreign exchange, commodities (crude oil, precious metals, agricultural products), equity indices, US equities, and digital assets — producing practical, research-backed educational content for traders.
Primary Sources (by Category)
- Trading platform documentation: MetaQuotes MT4/MT5 user guides (the Parabolic SAR indicator's formula, the Step/Maximum parameters, and how it is displayed)
- Research and reference: J. Welles Wilder, New Concepts in Technical Trading Systems (the original definition and calculation rules of Parabolic SAR); general treatments of Parabolic SAR and trend-following systems in standard technical-analysis references (Investopedia, BabyPips)