

Momentum Indicator: Formula, How to Read It, and Divergence

Moving averages and trendlines tell you which way price is going; momentum answers a different question — whether the move still has any force left in it. Price can keep making new highs while the force pushing it up quietly weakens, and that fading force is often the first sign of a coming reversal. Crucially, it usually shows up in momentum before it shows up in price.
This guide covers what momentum is and how it is calculated (including the difference between the textbook version and the MT4/MT5 built-in one), three basic ways to read it, its most valuable signal — divergence — its relationship to RSI, MACD and Stochastics, and how to display and use it in MT4/MT5.
- Momentum measures the speed of price change, comparing the current price with the price N periods ago, with the value oscillating around a midline.
- Textbooks use the difference form (around 0); the MT4/MT5 built-in uses the ratio form (around 100). Same direction, different scale.
- Three basic readings: a midline cross for a shift in force, the size of the value for the strength of the move, and the distance from the midline for whether it is overextended.
- Divergence is the most valuable use: when price makes a new high but momentum does not follow, the upward force is fading.
- Momentum is the shared basis of many oscillators — RSI, KD and CCI standardize it into a fixed range, and MACD measures it through the difference of two moving averages.
1. What Is the Momentum Indicator?
Momentum is one of the most basic indicators in technical analysis. The idea is straightforward: compare the current price with the price a set number of periods ago, see whether the gap is widening or narrowing, and use that to gauge the speed of the rise or fall.
In an uptrend, if the daily gains are getting larger, the upward force is strengthening. If price is still rising but each day adds less than the last, the force is fading — even though price has not turned yet, the drive behind it has already eased.
This points to momentum's key property: it can lead price. Momentum reflects the speed of price change, and when the force weakens first, price turns afterward. That is why it is used to sense the tiring of a trend early, without waiting for price to break a key level.
That said, a fading force only raises the probability of a reversal; it does not guarantee one. And because what it measures is the speed of change, momentum is fundamentally an indicator of volatility and force, not a tool for judging direction itself.
2. How Momentum Is Calculated
Momentum has two common formulas. They point the same way and differ only in scale. Note, though, that textbooks and MT4/MT5 do not use the same one, which is a frequent source of confusion.
The difference form (around 0)
The most common textbook definition simply subtracts:
The value oscillates around 0. Above 0 means the current price is higher than N periods ago (upward force); below 0 means downward force; the further from 0, the stronger the force. N is commonly set to 10, 12 or 14.
The ratio form (around 100)
The MT4/MT5 built-in "Momentum" uses a ratio, multiplied by 100:
The value oscillates around 100. Above 100 is upward force, below 100 is downward force. Expressing it as a percentage makes it easier to compare instruments trading at different price levels.
Here are the two side by side:
| Type | Formula | Midline |
|---|---|---|
| Difference (textbook) | Current − price N periods ago | 0 |
| Ratio (MT4/MT5 built-in) | Current ÷ price N periods ago × 100 | 100 |
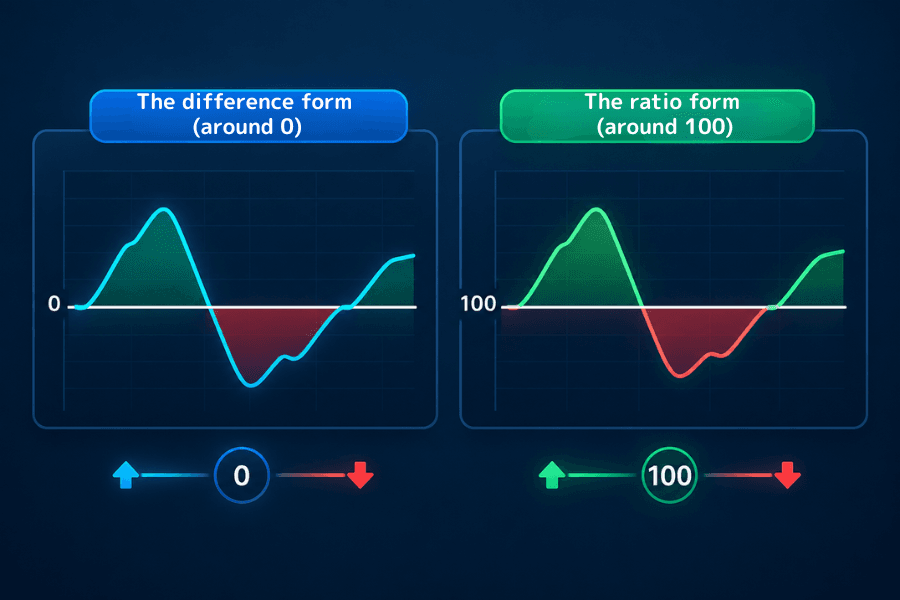
The reading logic is identical for both: which side of the midline (0 or 100) the value sits on, and how far from it. The rest of this guide says "midline," which you read as 0 or 100 depending on your platform.
3. Three Basic Ways to Read It
Reading 1: A midline cross, for a shift in force
When momentum crosses the midline from below, price has become higher than N periods ago and short-term force has turned bullish; a cross from above is the reverse. The midline cross is the most direct signal, but in a range it whipsaws back and forth, so it needs to be paired with trend judgment.
Reading 2: The size of the value, for the strength of the move
The further momentum is from the midline, the faster the current move. A value that keeps expanding usually means the trend is still accelerating; one that starts to converge means the force is weakening, even if price is still moving in the same direction.
Reading 3: The distance from the midline, for whether it is overextended
When momentum swings to an unusually high (or low) reading, the short-term move is running fast. But a high momentum reading does not necessarily mean a reversal; it can equally be the continuation of a strong trend. Whether it is "overextended" has to be read alongside price structure, not from the value alone.
There is also no fixed upper or lower bound to difference-form momentum, so "how high is high" has to be judged against that instrument's own past range, and the same number cannot be applied across instruments — unlike RSI, which has a fixed range.
4. Momentum Divergence: The Most Valuable Signal
The most valued use of momentum is divergence. It puts the "momentum leads price" property to its fullest use.
Divergence is when price and momentum move in different directions:
- Top divergence: price makes a new high, but momentum fails to (its peaks step lower). It shows the new high is being pushed up by progressively weaker force, the upward drive is fading, and a downside reversal may lead.
- Bottom divergence: price makes a new low, but momentum does not follow it down. The downward force is weakening, and a bottoming and rebound may lead.
The above is "regular divergence," which foreshadows a possible reversal.
There is also a hidden divergence that runs the opposite way: for example, in an uptrend pullback, price makes a higher low while momentum makes a lower low, showing the original upward force is still there — it is treated as a trend-continuation signal. Both compare the step of price against the step of momentum; only the interpretation differs.
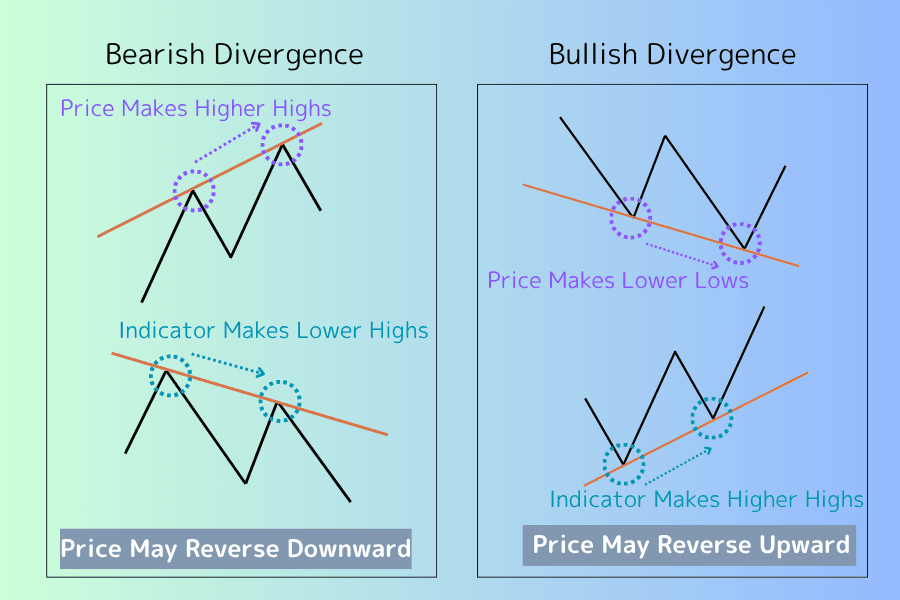
But divergence carries a limit worth remembering: divergence shows a fading force, not that price will reverse immediately. In a strong trend, divergence can persist for a long time while price keeps going.
So treat divergence as a signal to raise your guard, and act only after price itself confirms a turn (such as breaking a trendline). Entering a counter-trade the moment you see divergence is usually too early.
5. The Oscillator Family: Its Relationship to RSI, MACD and KD
Understand momentum and you have grasped the shared basis of a whole family of oscillators. The many oscillators out there are all answering the same question — the speed of price change — just packaged differently:
| Indicator | How it measures force | Character |
|---|---|---|
| Momentum | The difference or ratio of current price to price N periods ago | The most primitive; no fixed range |
| RSI | The relative size of gains versus losses over a period | Standardized to 0–100; easy to see overbought/oversold |
| Stochastic | Where the close sits within the recent high–low range | Standardized to 0–100; sensitive to the short term |
| CCI | How far price deviates from its statistical mean | Around 0, with ±100 as a guide |
| MACD | The difference between two moving averages of different periods | Combines trend and force, with a signal line |
In other words, RSI, KD and CCI standardize force into a fixed range so "overextended" has a clear scale, while MACD measures force through the difference of two moving averages.
All of them inherit the core logic of the original momentum indicator: measuring speed, potentially leading price, and producing divergence. Once you understand momentum, these indicators stop looking like a scattered collection.
6. Displaying and Using Momentum in MT4/MT5
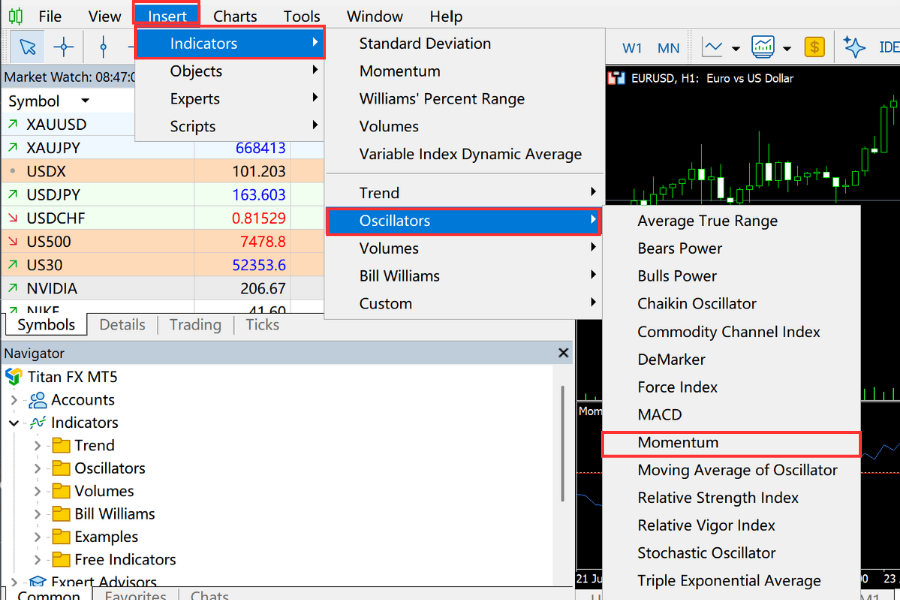
Momentum is a built-in MT4/MT5 indicator; no separate installation is needed. From the top menu, select "Insert" → "Indicators" → "Oscillators" → "Momentum", set the period (default 14), and it appears in a sub-window. The menu path is identical in MT4 and MT5; the screenshot below shows MT5. You can browse the platform's full indicator list on the page below.
Three things to keep in mind when using it:
- Many false signals in a range: momentum works best in a clear trend. In a sideways market the midline cross whipsaws repeatedly, and used alone it is easy to be misled.
- Do not look at momentum alone: it is a support tool. Judge direction mainly from price structure and trend, and use momentum to confirm force and hunt for divergence.
- The parameter changes sensitivity: a shorter period gives more signals but more noise; a longer one is steadier but slower. There is no optimal parameter, only one that suits your timeframe.
7. Momentum FAQ
Q1: How is momentum different from RSI?
Both come from the concept of momentum; the difference is the scale. Difference-form momentum has no fixed range, so "how high is high" has to be read against the instrument's own history. RSI standardizes momentum to 0–100, so fixed levels like 70/30 can flag overbought and oversold. Use RSI when you want a clear overbought/oversold scale, and momentum when you want the raw change in force.
Q2: Why does the MT4/MT5 Momentum center on 100, not 0?
Because the MT4/MT5 built-in version uses the ratio formula (current price ÷ price N periods ago × 100), so the baseline naturally lands at 100. The textbook difference form (subtraction) centers on 0. The direction and the reading logic are exactly the same; only the midline number differs.
Q3: After a momentum divergence appears, will price always reverse?
No. Divergence shows the force driving price is fading, but a weak force does not mean an immediate reversal — in a strong trend divergence can persist for a long time. Divergence is a signal to raise your guard; it is safer to act after price itself confirms a turn (such as breaking a trendline or key level) rather than on divergence alone.
Q4: What period should I set for momentum?
There is no fixed answer. The default is 14, and some use 10 or 12. A shorter period is more sensitive with more signals but more noise; a longer one is smoother but slower. The principle is to match your timeframe and, once chosen, keep it fixed to observe, rather than changing it often.
Q5: Is momentum suitable for use on its own?
Not recommended. Momentum is a support tool for measuring force, and it produces false signals easily in a range. In practice it is combined with a trend tool (such as moving averages or trendlines): set direction with the trend tool first, then use momentum to confirm force and look for divergence.
Q6: Which instruments can momentum be used on?
Conceptually, any instrument with continuous prices — forex, stocks, indices, commodities. Note that difference-form momentum's value depends on the instrument's price level, so its size cannot be compared directly across instruments; the ratio form (around 100) is more consistent in this respect.
8. Conclusion
Momentum measures not where price is going, but whether it still has the force to get there. It quantifies the speed of a move, and because force tends to change before price does, it carries a leading quality, which is exactly why divergence is so valued.
The key to using momentum well is recognizing its role: it is a support tool for confirming force and catching divergence, not a directional indicator for deciding entries on its own. Combined with trend judgment and acted on only after price confirms a turn, momentum delivers its strength of leading without overcommitting.
And once you understand momentum, the seemingly disparate oscillators (RSI, KD, CCI, MACD) all connect along a single thread.
Further Reading
- Trendlines: How to Draw Them and Use Them in Trading
- Bollinger Bands Complete Guide: Principles and Charting
- ATR (Average True Range)
- What Is the Exponential Moving Average (EMA)?
- Fibonacci Retracement Guide
Titan FX Trading Strategy Lab. We produce educational content for investors covering FX, commodities (crude oil, precious metals, agricultural products), stock indices, U.S. equities, and cryptocurrencies.
Primary Sources (by category)
- Trading platform documentation: MetaQuotes MT4/MT5 user guides on the Momentum indicator's formula and display
- Research and reference: general treatments of momentum and the oscillator family in major technical analysis resources (Investopedia, BabyPips, Murphy, Technical Analysis of the Financial Markets)