

Williams %R Explained: Formula, Overbought/Oversold Levels & the Stochastic/RSI Comparison
Williams %R is an oscillator created by Larry Williams that measures where the latest close sits within the recent high-low range, on a negative scale from 0 to -100. Readings above -20 mean the close is pressing the top of the range — overbought; readings below -80 mean it is pressing the bottom — oversold. The question it answers is concrete: within the range of the last N candles, is the current close near the highs or near the lows?
Among the popular overbought/oversold oscillators, Williams %R has an exceptionally simple calculation: no smoothing of any kind — the close's position inside the range is the reading. That makes it very responsive to changes in recent price position, and visibly jumpier than Stochastic or RSI. Understanding that temperament is the precondition for using it well.
This guide covers the definition and formula, how to read overbought/oversold levels, the -50 midline and divergence, what %R, Stochastic, and RSI each actually measure (the three are often lumped together, but their viewpoints differ), the indicator's weaknesses and filters, and how to display and configure it in MT4/MT5.
- Williams %R measures the close's relative position within the last N periods' high-low range (default 14), on a negative scale from 0 to -100.
- Above -20 is the overbought zone, below -80 the oversold zone; a close equal to the range high reads 0, a close equal to the range low reads -100.
- With the same lookback period, %R has a direct mathematical correspondence to Stochastic's raw Fast %K (%R = Fast %K − 100): same curve shape, different scale.
- Overbought does not mean sell: in a clear trend the indicator can pin to the extreme zone and stay overbought while price keeps climbing.
- The built-in MT4/MT5 Williams' Percent Range uses a default period of 14 — add it to the sub-window and it works.
1. What Is Williams %R?
Williams %R (%R for short) was developed in the 1970s by the celebrated American trader Larry Williams, famous for short-term trading and live-account results. The indicator inherits his style — a minimal construction built to capture short-term overbought and oversold conditions.
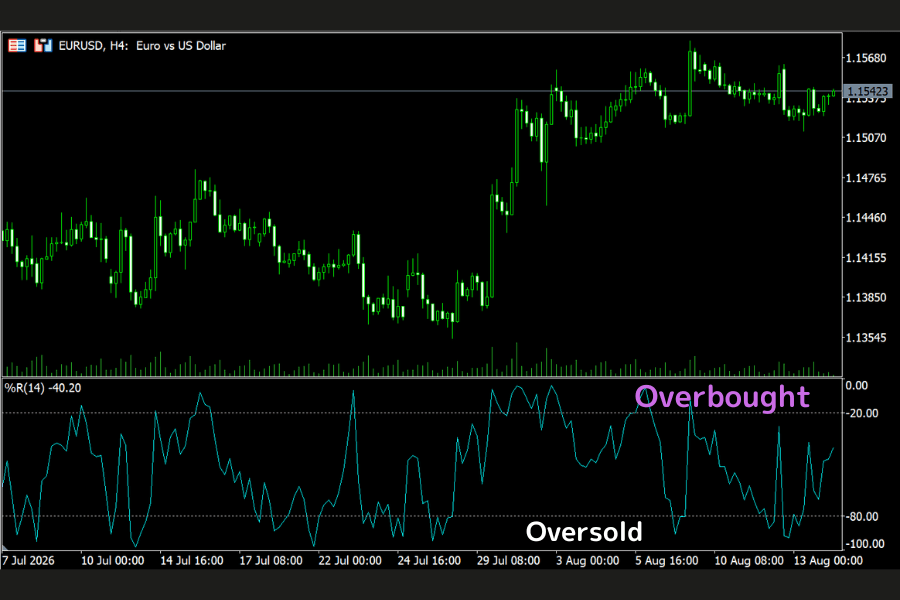
Williams %R appears in a sub-window as a single line oscillating between 0 and -100, and what it measures is simple: where the latest close sits within the recent high-low range. The closer the close is to the range high, the closer the reading is to 0; the closer to the range low, the closer to -100.
The negative scale is what confuses newcomers most: 0 sits at the top, -100 at the bottom — the closer to 0, the nearer the close is to the range ceiling (the overbought direction); the closer to -100, the nearer the floor (the oversold direction). Remember "ceiling = overbought, floor = oversold" and the chart reads itself.
2. The Williams %R Formula
The calculation uses just three numbers: the highest high and lowest low of the last N periods, and the latest close (N defaults to 14):
Unpacking what it computes:
- The denominator is the full recent range (highest high to lowest low over N periods).
- The numerator is how far the close sits below the top of that range.
- Dividing and multiplying by −100 converts "position inside the range" into a 0-to--100 reading.
The scale's endpoints follow directly: a close equal to the N-period high gives %R = 0; a close equal to the N-period low gives %R = −100.
Example: over the last 14 candles the high is 1.1000, the low 1.0800, and the latest close 1.0950 — %R = (1.1000 − 1.0950) ÷ (1.1000 − 1.0800) × (−100) = -25: the close sits in the upper part of the range, approaching but not inside the overbought zone.
Because the formula applies no smoothing, %R reacts the moment the close moves — responsive, but visibly rough. Its relatives — Momentum, Stochastic, and RSI — each handle that trade-off differently, compared in full in Section 4.
3. How to Read Williams %R: Overbought/Oversold, the -50 Midline, and Divergence
Reading 1: The overbought and oversold zones
The most basic read uses two horizontal lines:
- %R above -20: overbought zone — the close is hugging the top of the recent range; chasing strength carries elevated short-term risk.
- %R below -80: oversold zone — the close is hugging the bottom of the range; selling into weakness carries elevated short-term risk.
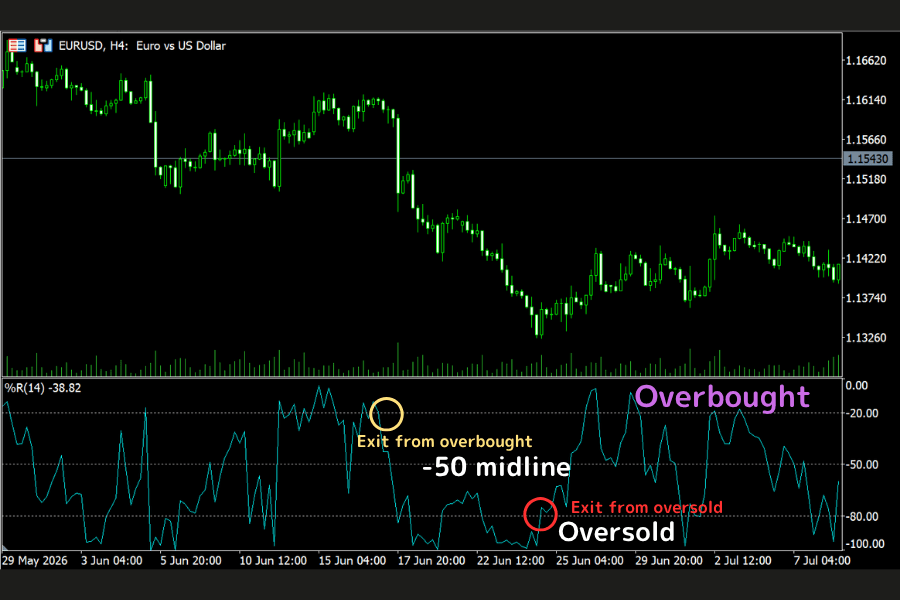
One common approach is to watch for %R exiting the oversold zone upward, or exiting the overbought zone downward. Compared with the moment the reading first enters -20 or -80, an exit from the extreme zone carries one extra piece of information — price has begun to turn — though it still does not guarantee a reversal: %R hugs price closely and can linger in an extreme zone for a long stretch.
Reading 2: The -50 midline
-50 is the exact middle of the range. %R above -50 means the close sits in the upper half of the recent range; below -50, the lower half. The midline works as a supplementary gauge of short-term price position, but should not serve as a standalone entry or exit signal.
Reading 3: Divergence
When price makes a new high but %R's peaks step lower (bearish divergence), or price makes a new low while %R's troughs step higher (bullish divergence), the close's relative position inside the range is weakening (or strengthening) — a warning worth more attention than a simple overbought or oversold reading. As with other oscillators, divergence should never be treated as reversal confirmation on its own; wait for actual change in the price structure.
To scan many instruments at once for readings at relative extremes, the RSI analysis heatmap on our site helps too — RSI and Williams %R are computed differently, but both can shortlist instruments whose short-term readings have stretched toward an extreme, as a first-pass filter for instrument selection.
4. Williams %R vs Stochastic vs RSI
All three are household-name oscillators, and they are constantly lumped together. The comparison that matters is not which is faster — it is what each one measures:
| Comparison | Williams %R | Stochastic | RSI |
|---|---|---|---|
| Core concept | Close's position within the N-period high-low range | Close's position within the N-period high-low range | Relative strength of average gains vs average losses |
| Typical lines | Single %R line | %K and %D lines | Single RSI line |
| Scale | 0 to -100 (negative) | 0 to 100 | 0 to 100 |
| Typical extremes | -20 / -80 | 80 / 20 | 70 / 30 |
| Response character | No smoothing; sensitive to range-position changes | Smoothed; two-line crossovers observable | Focused on the relative momentum of gains vs losses |
| Common uses | Range position, extreme zones, divergence | Overbought/oversold, %K/%D crossovers | Momentum strength, overbought/oversold, divergence |
Two relationships are worth memorizing:
① %R corresponds directly to Stochastic's Fast %K. With the same lookback period, %R = Fast %K − 100 — the two draw on the same information (the recent high-low range and the close's position in it), so the curves have the same shape and differ only in how the scale is expressed (%K runs 0–100 with 100 on top; %R runs -100–0 with 0 on top). The Stochastic most traders actually use adds smoothing settings and a %D signal line on top, which is why its curve usually runs smoother than raw %R.
② RSI measures something else. RSI computes the share of average gains within total average movement over N periods — nothing to do with range position. So when price parks near its highs without pulling back, %R can stay pinned near 0 while RSI drifts gently lower — differing readings mean differing viewpoints, not a broken indicator. CCI, which gauges how far price has strayed from a statistical average, offers yet a third lens.
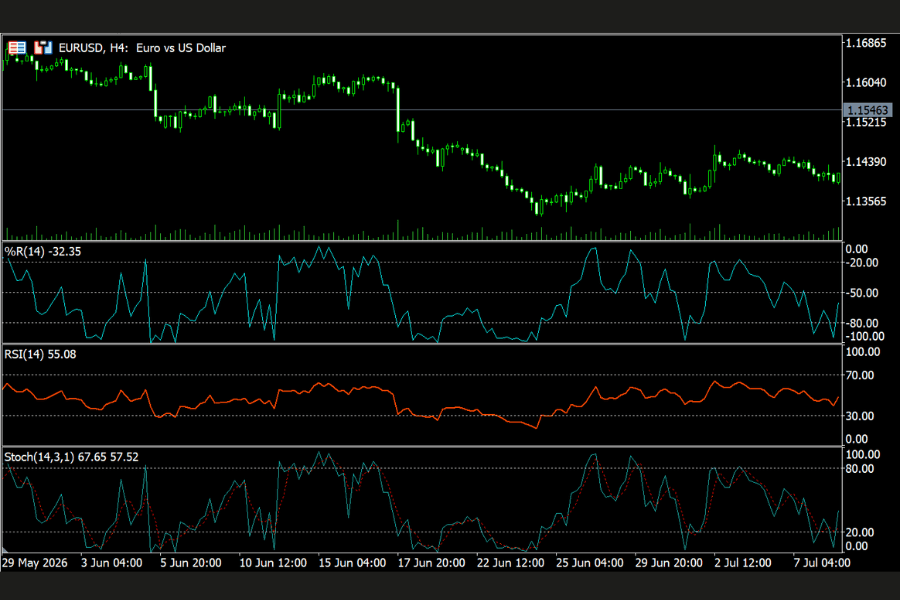
For practical selection, no single indicator is inherently better: prefer reading the close's range position off one responsive line — use %R; prefer smoothed, two-line crossover signals — use Stochastic; want momentum measured from average gains and losses — RSI fits. Their information overlaps heavily, so pick one; running all three at once mostly buys you contradictory readings.
5. Weaknesses and Caveats
It pins to extremes in trends: in a strong advance, %R can sit above -20 for dozens of candles — overbought does not mean a fall is due, and counter-trend shorting is one of the most common ways %R users lose money. In trending markets, treat the overbought zone as a "don't chase" caution, not a reversal entry.
Noise and false hooks are frequent: the cost of zero smoothing is a rough line, and small hooks inside the extreme zones are often noise. Waiting for two consecutive closes to confirm an exit from the zone, or lengthening the period, dampens the flutter.
Judge the market state first: %R's overbought/oversold logic reads most intuitively in sideways or range-bound markets; in a clear one-way trend, the reading can camp in an extreme zone for long stretches. Check trend strength with ADX/DMI before entering, and only then do counter-trend signals earn reference value.
Always pair it with a stop: oversold can get more oversold, and a failed bottom-fish without a stop lets a single loss spiral. Anchor stops beyond the recent swing low or the range boundary so every counter-trend attempt has a hard risk cap.
6. Williams %R Settings in MT4/MT5
Williams %R is built into MT4/MT5 — nothing to install. In MT5, from the menu at the top of the chart select Insert → Indicators → Oscillators → Williams' Percent Range, and the indicator appears in a sub-window beneath the main chart. The menu path is essentially identical in MT4 and MT5; the screenshot below shows MT5.
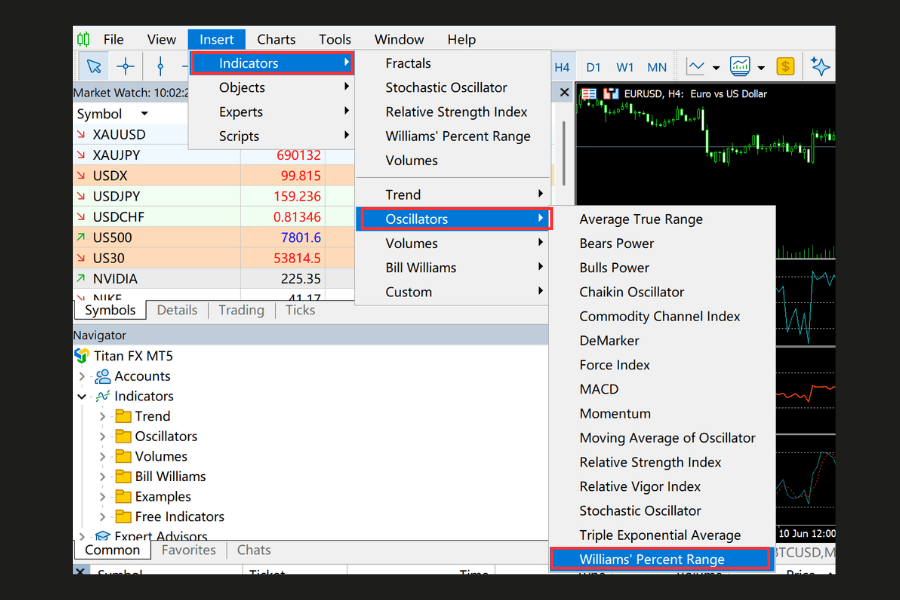
The settings window has one core parameter — the period (default 14). Shortening it generally makes %R more sensitive to recent price changes and produces more signals; lengthening it filters out some short-term noise and calms the line. Traders can test 9, 20, or other values, but the right setting depends on the instrument, the timeframe, and your strategy. The -20/-80 horizontal lines can be edited on the Levels tab — some traders also test stricter thresholds such as -10/-90: the closer the levels sit to the extremes, the fewer signals typically qualify, though that does not guarantee each signal succeeds more often. To browse the full list of indicators the platform offers, see the page below.
All Custom Indicators7. FAQ
Q1: Why are Williams %R values negative?
It is the scale convention of Larry Williams' original design: 0 represents "close equals the recent range high," -100 "close equals the range low," so the reading expresses depth below the ceiling. For interpretation, just remember: the nearer 0, the closer the close is to the range ceiling; the nearer -100, the closer to the floor.
Q2: Williams %R or Stochastic — which should I use?
They draw on the same information — the recent high-low range and the close's position within it. With equal periods, %R and the raw Fast %K share the same curve shape and differ only in scale; the commonly used Stochastic adds smoothing and the %K/%D pair on top. Prefer one responsive line reading range position directly — %R; prefer smoothed two-line crossover signals — Stochastic. Neither is inherently better in all conditions; pick one.
Q3: Can the -20 and -80 lines be adjusted?
Yes. Both MT4 and MT5 let you edit them on the indicator's Levels tab, and some traders test stricter thresholds such as -10/-90 by strategy. Note that pushing the levels toward the extremes usually reduces how many signals qualify, but does not guarantee a higher success rate per signal — combine with other conditions and verify.
Q4: Is Williams %R suitable as a standalone entry trigger?
No. It answers only "where is the close within the recent range" — neither trend direction nor strength. The sturdier role is as one condition among several, combined with trend direction, price structure, support and resistance, and risk management; and the reading of overbought/oversold should change with the market state (trending vs ranging).
Q5: Whose divergence is more reliable — Williams %R's or RSI's?
No divergence has been proven inherently more reliable across all instruments and timeframes. %R and RSI rest on different calculations — range position versus the relative strength of average gains and losses — so their divergences can naturally appear at different places and frequencies. What matters in practice is whether a divergence is then confirmed by price structure, support and resistance, or a change in trend — not which indicator's divergence "scores better."
8. Conclusion
With one unadorned formula, Williams %R translates "where the close sits in the recent range" straight into a 0-to--100 reading: above -20 overbought, below -80 oversold, -50 the middle of the range. With no smoothing, it responds keenly to shifts in recent price position — and demands discipline in equal measure: it pins to extremes in clear trends and runs rougher than Stochastic or RSI, so confirm the market state first, wait for the reading to exit the extreme zone, and never trade it without a stop.
Once you understand its mathematical correspondence to Stochastic's Fast %K (%R = Fast %K − 100 — same shape, different scale) and its difference in viewpoint from RSI (range position versus average gain/loss strength), you can pick the right tool from this family to match how you read markets — no need to stack all three and wrestle with contradictory readings.
Further Reading
- MACD Indicator Explained: Complete Beginner's Guide with Trading Examples
- Moving Averages (MA) Complete Guide: Types, Settings, and Practical Use
- Bollinger Bands Complete Guide: Principles, Standard Deviation, Formula, and Plotting
- Parabolic SAR Complete Guide: Reading, Parameters, and Trailing Stops
- Ichimoku Kinko Hyo: Principles, Setup, and Trading Strategies
Titan FX Research Team. We cover a broad set of financial instruments — foreign exchange, commodities (crude oil, precious metals, agricultural products), equity indices, US equities, and digital assets — producing practical, research-backed educational content for traders.
Primary Sources (by Category)
- Trading platform documentation: MetaQuotes MT4/MT5 user guides (the Williams' Percent Range formula, period parameter, and display)
- Research and reference: Larry Williams' original treatment of %R; general coverage of Williams %R and oscillators in standard technical-analysis references (Investopedia, BabyPips)