

On-Balance Volume (OBV) Explained: Calculation, Divergence, and How to Use It in Forex
On-Balance Volume (OBV) is a technical indicator that accumulates volume according to the direction of the close: when a period closes higher than the previous one, its volume is added; when it closes lower, its volume is subtracted — producing a running line that shows whether the direction of volume is confirming the price move. It was introduced by Joseph Granville in 1963, built on his working assumption that volume leads price — changes in volume structure can sometimes show up before the price reflects them.
Price alone rarely tells you how much market participation sits behind a move. Volume adds a second dimension. OBV folds price direction and volume into a single line, and the question it answers is specific: is the current rally or decline being confirmed by the direction of cumulative volume?
This article covers how OBV is calculated, the three main ways to read it (confirmation, divergence, and leading breakouts), which indicators pair well with it, the tick-volume limitations specific to forex, and how to display it in MT4/MT5.
- OBV accumulates volume by the direction of each close. What matters in practice is the line's direction, highs and lows, divergences, and breakouts — the absolute value rarely means much on its own.
- Three main uses: price and OBV moving together (trend confirmation), the two diverging (non-confirmation), and OBV breaking out first (volume structure changing early).
- Divergence is OBV's signature signal: price makes a new high while OBV does not, meaning cumulative volume has not confirmed the new high — a possible warning that momentum is fading.
- The "volume" in margin forex platforms is tick volume — the number of price changes — a proxy for market activity. Read it more conservatively than exchange-traded volume.
- OBV works best as a confirmation tool. On its own it is easily whipsawed; entries and exits should still be decided on price structure.
- 1. What Is On-Balance Volume (OBV)?
- 2. How OBV Is Calculated: Add on Up Closes, Subtract on Down Closes
- 3. How to Read OBV: Three Core Patterns
- 4. Which Indicators Pair Well with OBV?
- 5. OBV in Forex: Tick-Volume Limits and Caveats
- 6. How to Display OBV in MT4/MT5
- 7. On-Balance Volume FAQ
- 8. Summary
1. What Is On-Balance Volume (OBV)?
On-Balance Volume (OBV) is a volume indicator that sorts each period's volume by the direction of the close and keeps a running total: close higher than the previous period, and the period's volume counts as positive; close lower, and it counts as negative. Accumulated over time, the OBV line traces how volume has stacked up along the direction of price.
Granville designed the indicator around a practical problem: volume bars jump around independently from one period to the next, which makes direction hard to read. Once volume is sorted by up and down closes and accumulated, the scattered bars become a single line with a trend of its own, and the ebb and flow of volume becomes visible.
The core assumption behind it is that volume leads price: Granville argued that shifts in market participation sometimes appear in volume structure first and only later in price. It is worth stressing that this is an analytical assumption — nothing in the market guarantees the sequence plays out every time. OBV is therefore used mainly to check whether a trend has volume behind it, and to raise an early flag when volume and price stop agreeing.
2. How OBV Is Calculated: Add on Up Closes, Subtract on Down Closes
OBV follows just three rules:
- ① Current close above the previous close: OBV = previous OBV + current volume
- ② Current close below the previous close: OBV = previous OBV − current volume
- ③ Close unchanged: OBV stays the same
A five-period mini example shows how the total builds (starting OBV set to 0):
| Period | Close | vs Previous | Volume | OBV |
|---|---|---|---|---|
| Period 1 | 100 | — | 8,000 | 0 |
| Period 2 | 102 | Higher | 12,000 | +12,000 |
| Period 3 | 101 | Lower | 6,000 | +6,000 |
| Period 4 | 103 | Higher | 15,000 | +21,000 |
| Period 5 | 105 | Higher | 18,000 | +39,000 |
Note one key detail: whenever the close is higher than the previous period, the entire volume of that period is added. OBV only sorts volume by direction — it does not split a candle into its actual buy and sell orders, and it cannot identify who was trading.
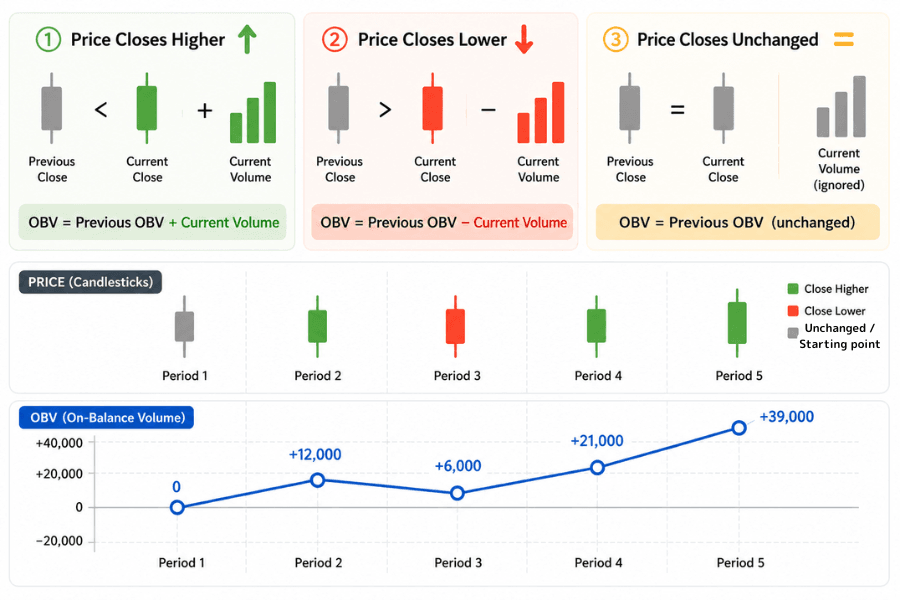
Another property follows directly: OBV's absolute value is rarely meaningful on its own. Change the starting point and every number changes; values cannot be compared across instruments. Reading OBV comes down to two things — the line's direction (rising, falling, flat) and its shape (new highs and lows, divergences, breakouts).
OBV also has no traditional period parameter. There is nothing like a 14 or 20 to set; sensitivity is determined by the chart timeframe. Larger timeframes smooth out some short-term noise and make the shape easier to read, while smaller timeframes react faster to quote activity. Depending on the platform and instrument, the input can be tick volume or real volume (see Section 6).
3. How to Read OBV: Three Core Patterns
Reading OBV revolves around one pair of concepts: confirmation and non-confirmation — whether the direction of cumulative volume is keeping up with price.
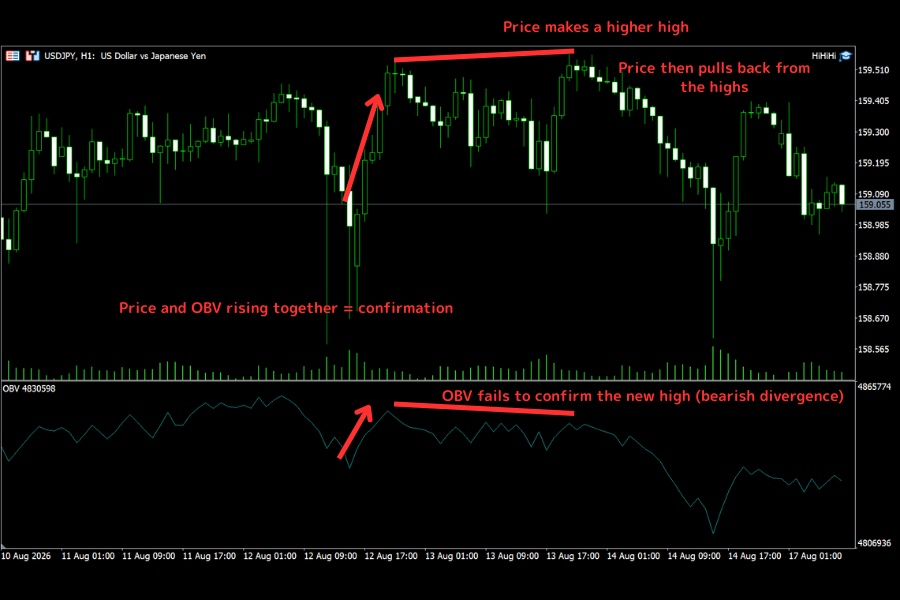
① Price and OBV moving together: trend confirmation. When price and OBV both print higher highs and higher lows, the price trend and the direction of volume are confirming each other; the same logic applies in a downtrend when both fall together. If price is still stuck in a range while OBV has already built a clear rising structure, volume and price are temporarily out of sync — worth watching to see whether a price breakout follows.
② Price and OBV diverging: a non-confirmation signal. Price makes a new high but OBV does not — cumulative volume has failed to confirm the new price high. That is bearish divergence; price making a new low that OBV does not follow is bullish divergence. The logic is the same as divergence on any other indicator: the indicator and price are telling different stories. It can be an early warning that momentum is fading, but it does not by itself prove a reversal is coming. Divergences can persist for a long time, so entries and exits still wait for price to confirm.
③ OBV breaking out first: volume structure changing early. OBV is a line like any other — you can draw trendlines on it and mark its recent highs and lows. Granville observed that OBV sometimes clears its own resistance or support ahead of price. When price is still boxed in a range and OBV has already pushed to a new high, treat it as volume structure moving early, then watch whether price follows through with its own breakout — in the end, price decides.
4. Which Indicators Pair Well with OBV?
OBV covers the volume dimension; the price dimension belongs to other tools, and the two are cross-checked against each other. Two groups of pairings are enough.
Trend tools: confirming direction. Use a moving average or price structure to define the trend, and only consider trades in the direction that agrees with OBV. You can also overlay a moving average on the OBV line itself and use OBV crossing above or below its own average as a cue that volume is turning.
Momentum tools: comparing non-confirmation across two dimensions. MACD and RSI measure the momentum and relative strength of price itself, and the Momentum indicator measures how far price has moved over a fixed window — all of them are built from price, while OBV is built from volume. When price makes a new high and neither the momentum tools nor OBV keeps up, two independent dimensions are flashing non-confirmation at once — a useful prompt to examine the price structure more carefully.
5. OBV in Forex: Tick-Volume Limits and Caveats
① MT4/MT5 volume is tick volume. Forex is a decentralized over-the-counter market with no central exchange tallying total volume. The "volume" shown on the platform is actually the number of price changes (ticks) within each candle. Some research has found a correlation between tick frequency and actual trading activity, but its strength varies with the data source, the sampling frequency, and market conditions. Tick volume works as a proxy for market activity; it cannot be read as the market's true traded volume.
② Compare only within the same data source. Different brokers stream quotes at different rates, so absolute tick-volume figures differ too. Forex OBV is best compared against its own history — same feed, same instrument, same timeframe. Comparing OBV values across platforms tells you nothing.
③ There are no overbought or oversold levels. OBV is a running total with no fixed range, so there is nothing like RSI's 70/30 thresholds. Its absolute value is rarely meaningful on its own; the only valid benchmark is its own past shape.
④ Watch for distortions from sessions and events. In a sideways market the close direction flips back and forth, OBV oscillates with it, and the directional information gets thin. Some pairs see tick volume drop sharply in low-liquidity sessions, and the tick count spikes around major data releases. OBV shapes formed in those windows deserve a discount.
⑤ Act only after price confirms. The point of using OBV in forex is to track relative changes in activity within one data source and check whether they confirm the price structure. Treat OBV as supporting evidence and leave the final entry and exit decisions to price — for example, run a breakout through the false breakout filters before deciding to follow it.
6. How to Display OBV in MT4/MT5
OBV is built into MT4/MT5 — no extra installation needed. In MT5, go to "Insert" → "Indicators" → "Volumes" → "On Balance Volume" from the menu above the chart, and OBV appears in its own subwindow below the main chart.
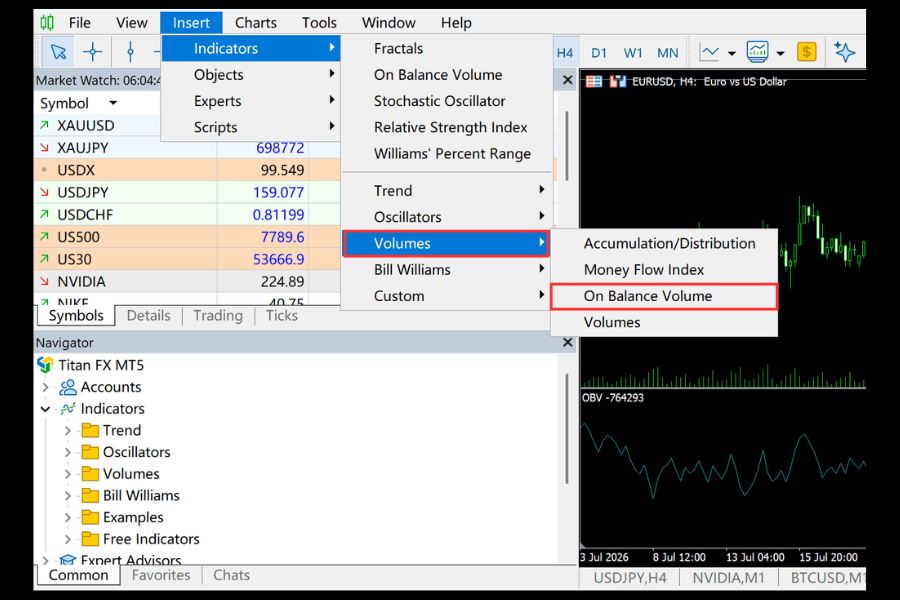
The settings window lets you choose which volume series feeds the calculation. Typical OTC forex symbols only carry tick volume (the count of price changes), so select Tick; whether Real Volume is available depends on the instrument type and whether the server supplies market data — exchange-traded products are more likely to support it. Line color and width can be adjusted to taste.
In MT4 the menu names differ slightly: go to "Insert" → "Indicators" and pick "On Balance Volume" from the Volumes category. The display works the same way as MT5. For the full list of indicators available on the platform, see the page below.
All Custom Indicators7. On-Balance Volume FAQ
Q1: How high does OBV have to be to count as "high"?
There is no universal threshold, and absolute values cannot be compared across instruments. OBV is a running total from an arbitrary starting point — change the start date or the symbol and every number changes. What matters is how the line behaves against its own history: trend, highs and lows, divergences, and breakouts.
Q2: How is OBV different from the volume histogram?
The volume histogram shows the size of each period's volume in isolation. OBV adds or subtracts each period's volume from a running total according to the close direction, which makes it easier to see whether the cumulative direction of volume is in sync with price. Use the histogram to spot single-bar volume spikes and OBV to track volume trends and divergences.
Q3: Forex has no central exchange — is OBV still useful?
Yes, within limits. Platform volume is the number of price changes (tick volume). Some studies find a meaningful correlation between tick frequency and actual trading activity, but the relationship depends on the data source, sampling frequency, and market conditions. Treat tick volume as a proxy for activity, focus on shapes rather than values, and never read the numbers as the market's true total volume.
Q4: Can I enter a trade as soon as an OBV divergence appears?
A divergence is a warning, and on its own it only says volume and price are out of sync. Divergences can run for a long time while price keeps making new highs. In practice, wait for the price structure itself to confirm — a break of a neckline or trendline, for example — before considering action, and set your stop in advance.
Q5: Which timeframe suits OBV best?
OBV works on any timeframe, and there is no fixed best choice. Larger timeframes filter out some short-term tick noise and make shapes easier to read; smaller timeframes react faster and carry more noise. The right choice depends on your strategy and the instrument — just keep comparisons within a single timeframe against its own history.
Q6: What separates OBV from the A/D line (Accumulation/Distribution)?
Both are cumulative volume indicators; the difference is how volume gets counted. OBV looks only at whether the close is above or below the previous close and assigns the entire period's volume to one side. The A/D line weights each period's volume by where the close sits within the period's high-low range. Fed the same price and volume data, the two lines can take different shapes. Pick one and read it against its own history.
8. Summary
On-Balance Volume organizes scattered volume bars into a single directional line: moving with price it confirms the trend, disagreeing with price it warns of non-confirmation, and breaking out first it hints that volume structure has changed early. The calculation is as simple as an indicator gets, the reading is all in the shape, and the absolute value rarely deserves attention on its own.
Using OBV in forex starts with accepting one premise: platform volume is tick volume, a proxy for market activity. Position OBV as a confirmation tool, cross-check it with price structure, moving-average direction, and momentum indicators, and act only once price confirms. Do that, and OBV reliably fills in the volume-price piece of the analytical puzzle.
Further Reading
- Stochastic Oscillator: Definition, Setup, and Trading Tips
- Williams %R Explained: Formula, Overbought/Oversold Levels & the Stochastic/RSI Comparison
- Bollinger Bands Complete Guide: Principles, Standard Deviation, Formula, Pros & Cons and MT4/MT5 Plotting
- Ichimoku Kinko Hyo: Principles, Setup, and Trading Strategies
- How to Read Candlestick Charts: A Comprehensive Guide to 20 Candlestick Patterns and Market Predictions
Titan FX Research Team. We cover a broad set of financial instruments — foreign exchange, commodities (crude oil, precious metals, agricultural products), equity indices, US equities, and digital assets — producing practical, research-backed educational content for traders.
Primary Sources (by Category)
- Theory: Joseph Granville, "Granville's New Key to Stock Market Profits" (1963), the original source of OBV; the volume-analysis chapters of John J. Murphy, "Technical Analysis of the Financial Markets"
- Platform documentation: MetaQuotes MT4/MT5 official guides — the On Balance Volume indicator and the definitions of tick volume and real volume
- Market research: published research on the correlation between FX tick frequency and actual trading activity; the Titan FX MT4/MT5 indicator list and price data