

False Breakout: How to Spot It, Filter It, and Trade the Failure
This is usually not the market malfunctioning. Large clusters of orders already sit at the level being broken, and price gets pushed up there for a simple reason: that is where there is something to trade against. Which is why the core of trading around false breakouts is judging whether a break has follow-through. Buying the moment price clears a key level is the most common way to handle it, and also the most expensive. Most tutorials treat the false breakout purely as a trap to avoid, and the advice is much the same everywhere: wait for the close, check volume, wait for the retest. All of that helps, but it leaves out two things that matter more — why false breakouts concentrate at particular levels and particular hours, and why a break that has already failed is itself a high-quality entry signal.
This article covers the mechanism behind false breakouts, how they differ from a throwback, four filters you can actually apply (including why volume does not transfer to FX), and how to trade the failure in the opposite direction.
- False breakouts cluster at prior highs and lows and at range boundaries, because that is where stop orders and breakout orders pile up.
- A false breakout and a throwback look alike and mean the opposite: one returns inside the range, the other holds outside it.
- Spot FX has no centralised volume. What MT4/MT5 shows on an FX chart is tick volume, and treating it as share volume leads to the wrong read.
- Thin-liquidity hours — holidays, the Asian early session, the instant of a data release — are where false breakouts concentrate.
- A confirmed failure can be traded in reverse, because it gives you a stop level you can define in advance.
1. What Is a False Breakout?
Definition: it cleared the level, but did not hold
A false breakout is when price breaks a key level — a prior high, a prior low, a trendline, the boundary of a consolidation pattern — then fails to follow through and returns quickly to the range it came from.
What actually matters here is whether it held after clearing the level. Price poking through a key level intraday is routine; what determines the character of the move is which side it closes on, and whether the move continues afterwards.
Why it deserves separate attention
False breakouts are not a rare exception. Breakout strategies rest on the assumption that price leaving a range will keep going, and a substantial proportion of the time that assumption does not hold. This is the main source of losses on breakout entries.
The way the loss arrives is worth noting too. Traders chasing a breakout tend to open positions where short-term momentum is strongest, and that point usually sits close to the extreme of the false breakout. When the break fails, the retracement is larger than expected.
2. Why False Breakouts Happen
Most explanations say "buying dried up" or "momentum was insufficient." That is the outcome, not the cause. To understand false breakouts you have to look at how orders are distributed.
Key levels are where orders accumulate
Picture a range that has been rejected at the same price several times. The longer it persists, the more three kinds of orders build up around that level:
| Order type | Who placed it | Direction |
|---|---|---|
| Stop-loss orders | Traders short inside the range, betting the level holds | Triggered on the break, becoming buys |
| Breakout orders | Traders waiting to enter only once it breaks | Triggered on the break, also buys |
| Profit-taking orders | Traders who bought at the range low | Sells on the break |
The first two fill all at once the moment price clears the level, producing what looks like a powerful thrust. But what is driving that thrust is passively triggered orders — there is very little active bullish money behind it.
Once those orders are absorbed, if no fresh buying steps in, price loses its support. That is the typical structure of a false breakout. "A breakout without volume" is, at bottom, describing exactly this.
Large orders need a counterparty
There is a more practical layer to it: a large position needs enough liquidity to fill.
A participant looking to build a large short needs someone buying on the other side. And the area above a key level is exactly where stop buy orders and breakout buy orders sit — price moving up there is what creates the conditions for those fills.
One misreading is worth heading off here: this does not mean there is some fixed practice of "stop hunting" in the market. It follows naturally from how liquidity is distributed — price tends to travel toward where orders are concentrated, and no assumption of manipulation is required.
3. Where and When They Cluster
Once the mechanism is clear, the levels and the hours follow from it.
Levels: the more orders, the more false breaks
- Obvious prior highs and lows: seen by the most traders, and where stop orders pile up most heavily.
- Boundaries of consolidation patterns: the upper and lower edges of triangles, boxes, flags and other continuation patterns are the textbook entry points, so orders are especially dense there.
- Round numbers: levels like 1.1000 or 150.00 attract a disproportionate share of manually placed stops and limit orders.
- Pattern lines: the neckline of a head and shoulders works the same way.
- The previous session's high and low: widely referenced by short-term FX traders, and the Asian session's extremes often get tested during the European session, so orders build there too.
Hours: the thinner the liquidity, the easier it is to push through
False breakouts are directly tied to how much the market can absorb at that moment. The thinner the book, the less capital it takes to push through a key level.
That makes false breakouts noticeably more frequent in these windows:
- The Asian early hours and major-market holidays: few participants, so modest flows can move price.
- The instant of a major data release: price whips in both directions, and stops on both sides can trigger within seconds of each other.
- The gap between trading sessions: liquidity is thinnest between the New York close and the Tokyo open.
The reverse also holds: a breakout that occurs while the London session overlaps New York is generally more credible, because there is enough capital present to genuinely move price.
4. False Breakout vs Throwback
These two look alike and mean the opposite, which makes them the easiest pair to confuse in practice.
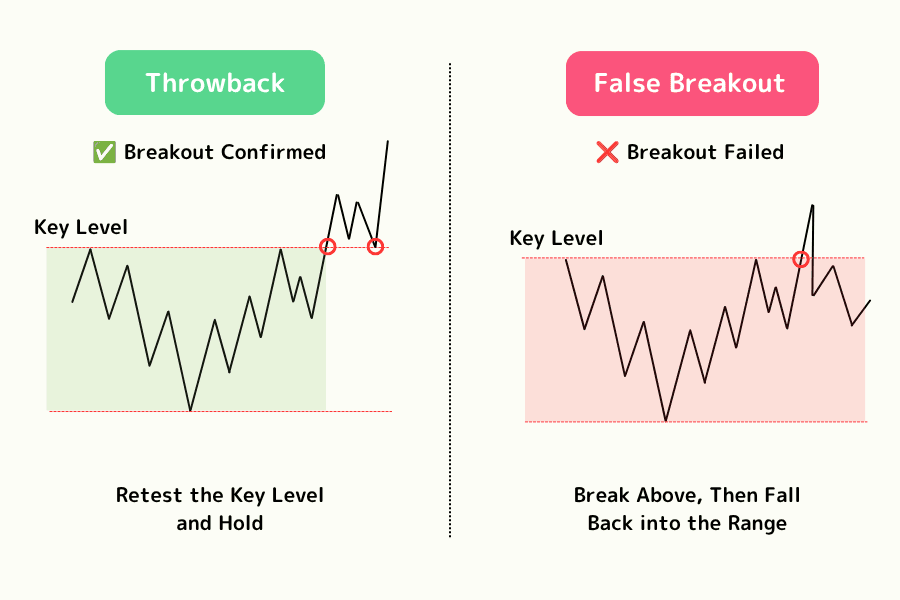
| False breakout | Throwback | |
|---|---|---|
| Price path | Clears the level, then falls back inside the range | Clears it, retests the level, but holds outside |
| Where it closes | Back on the pre-breakout side | Stays on the post-breakout side |
| What it means | The breakout failed | The breakout is valid, and role reversal is complete |
| What to do next | Consider the reverse | An opportunity to enter on the dip |
The dividing line is clear: on the retest, did price hold the original level? Holding and bouncing is a throwback; dropping back inside the range is a false breakout.
One point of terminology worth keeping straight, since both words get used loosely. In the classic literature the two are directional opposites: a throwback is the return to the level after an upside breakout, while a pullback is the return to the level after a downside breakout. Modern usage often treats "pullback" as any retracement, so it is worth checking which sense an author intends.
In practice this judgement requires waiting — and it is precisely because it requires waiting that so many traders enter before it is confirmed.
5. Four Filters (and the FX Exception)
Filter 1: the close
The most general-purpose method: only count it if the candle closes on the other side of the key level; intraday penetration does not qualify.
Note that the timeframe you choose changes the answer. On the same move, the 1-hour may already have confirmed a breakout while the daily has not closed yet. Which means "is this a false breakout?" can have different correct answers on different timeframes.
Filter 2: distance
Require the break to exceed a certain magnitude. Traditional technical analysis often cites a fixed percentage, but the more practical approach is to base the threshold on the instrument's current range — for example, requiring the break to exceed the recent ATR. The bar then adjusts to the market automatically and does not become meaningless in high-volatility conditions.
Filter 3: time
Require price to stay on the other side long enough — for instance, two consecutive candles closing outside. One of the defining features of a false breakout is speed. A genuine breakout is not in a hurry to come back.
Filter 4: volume — but FX needs care here
This is the item most worth spelling out.Most technical analysis material recommends confirming breakouts with volume. That works in equities, where a central exchange matches trades and volume is real data. But the spot FX market has no central exchange. Trading is spread across banks and liquidity providers worldwide, and no single party can total up true traded volume.
What MT4/MT5 displays as volume on an FX chart is in fact tick volume — a count of how many times the quote updated during the period, unrelated to how much actually changed hands.
| Equity volume | FX tick volume | |
|---|---|---|
| What it actually is | Shares or value traded | Number of quote updates |
| Where it comes from | A central exchange | The one broker you are connected to |
| Consistency across brokers | Consistent | Values can differ by broker |
None of this makes tick volume useless. Frequent quote updates usually do correspond to active trading, so it works as an approximation of market activity. Two things are worth remembering, though: it measures frequency rather than value, and it reflects only the quote flow your own broker sees.
So in FX, rather than leaning on volume, prioritise the first three filters and factor in which trading session you are currently in.
6. Trading the Failure
Everything above is about avoiding false breakouts. Seen from the other direction, though, a break whose failure has been confirmed is a signal carrying a lot of information.
Why a failed breakout can be traded in reverse
When price breaks out and drops straight back into the range, two things have happened at once: the traders who took the breakout are stranded outside, and their stop levels are now obvious — just beyond the extreme that was printed a moment ago.
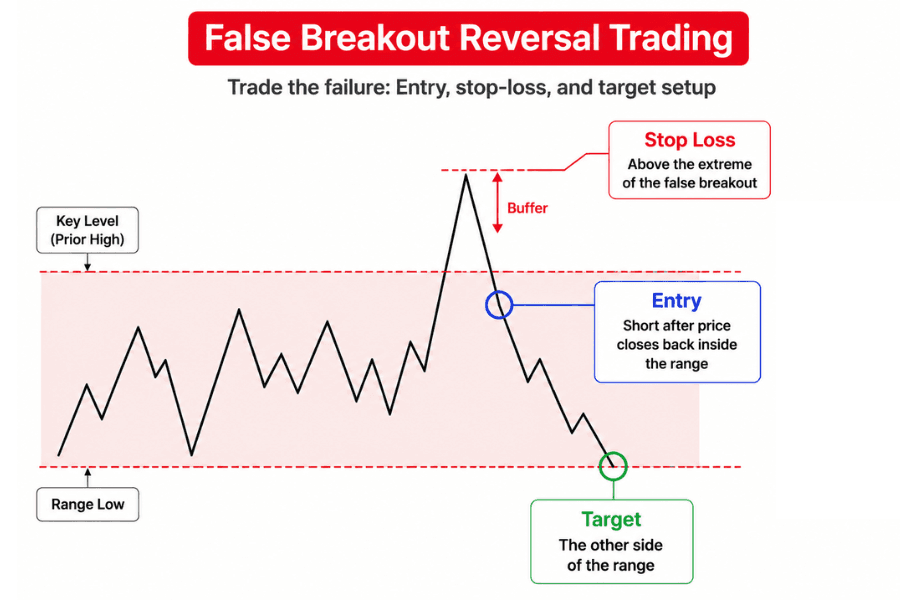
That gives a reverse position an unusual advantage: the stop level can be defined precisely in advance. Place the stop beyond the extreme of the false breakout and your maximum risk is known from the outset. The target can look toward the other side of the range.
The scope needs qualifying. In a ranging market this structure tends to work out better than chasing the breakout; in a strong trend, what looks like a failed signal may be no more than a temporary pause before price continues in its original direction.
A common framework
- Condition: price breaks a key level and returns inside the range within a short time.
- Entry: enter in the opposite direction once the return is confirmed — for instance once a candle has closed back inside the range. Do not try to pick the top at the extreme.
- Stop-loss: beyond the extreme of the false breakout, with some buffer.
- Target: the other side of the range, or the previous clear support or resistance.
Two necessary cautions
First, this is still a counter-trend trade. In a strong trend, an apparent false breakout may be a brief pause before price resumes its original direction. So the approach has a higher success rate in ranging markets and calls for particular caution in one-way trends.
Second, do not assume the break will fail while it is happening. Waiting for confirmation costs you part of the move, but it saves you the cost of getting the direction wrong — and the entire edge of this approach rests on the failure already being confirmed.
7. False Breakout FAQ
Q1: Are "false breakout" and "failed breakout" the same thing?
Broadly yes, described from different angles. "False breakout" emphasises that the signal was not genuine; "failed breakout" emphasises that nothing followed the break. In practice the terms are used interchangeably, as is "fakeout."
Q2: Can I tell a real breakout from a false one in the moment?
Not with certainty — that is inherent to breakout trading. What you can do is improve the odds: wait for the close, require enough distance, and check whether it happened during a liquid session. Every method amounts to paying time for certainty.
Q3: Can I use volume to judge breakouts in FX?
You need to understand what you are looking at. Spot FX has no central exchange, and what MT4/MT5 shows is tick volume — the count of quote updates, not traded value — and the figures can differ between brokers. It works as a rough gauge of activity, but not the way equity volume does.
Q4: Does price always reverse after a false breakout?
No. It may simply return to the range and keep oscillating, or attempt the breakout again later and succeed. What a false breakout offers is a setup with a favourable risk structure, not a guaranteed reversal signal.
Q5: Does the direction change how a false breakout works?
No — only the orientation changes. Price breaking below support, failing, and climbing back into the range is the same phenomenon. The cause, the way to identify it, and the trading logic are identical; only the direction of the accumulated orders is reversed.
Q6: Why are round numbers especially prone to false breakouts?
Because manually placed orders cluster at round figures. Most people set stops and limits at 1.1000 or 150.00 rather than at 1.10037, so orders build up disproportionately there and price is correspondingly more likely to be drawn to the level.
Q7: Which timeframe should I use to judge a false breakout?
Whichever one you actually trade, though longer timeframes give steadier readings. A false breakout on the 5-minute chart may be nothing more than a wick on the daily, while a daily-level false breakout carries considerably more information.
8. Summary
The false breakout is inseparable from breakout trading. Treated as random noise, it can only be endured; seen through to the order distribution underneath, it becomes something you can anticipate and, at times, use.
The difference that view makes is practical. The levels and hours where false breaks concentrate can be mapped in advance — the more orders accumulate and the thinner the liquidity, the more scepticism a break deserves. FX has no true volume, so importing the equity habit of confirming with volume only produces a distorted reading; session timing and range are the more reliable inputs.
And once a break has failed and that failure is confirmed, both the stop level and the target are relatively well defined. Between avoiding false breakouts passively and using them deliberately, all that sits in between is one confirmation.
Further Reading
- Triangle Patterns: Features, Analysis Methods, and Strategies
- Double Top and Bottom Patterns: Features and Strategies
- How to Read Candlestick Charts
- Volatility
- Slippage
Titan FX Research. Investor-education content covering forex (FX), commodities (oil, precious metals, agricultural products), stock indices, US equities, and crypto assets across global markets.
Primary Sources (by Category)
- Technical analysis classics: John J. Murphy, Technical Analysis of the Financial Markets — breakout confirmation conditions and the handling of failed breaks; Edwards & Magee, Technical Analysis of Stock Trends — pattern-boundary break criteria, filtering principles, and the throwback/pullback distinction
- Market structure: the decentralised architecture of the spot FX market versus a central exchange; MetaQuotes MT4/MT5 documentation — chart Volume represents tick volume, the count of quote updates
- Market data: Titan FX live rates and trading-session data