

Pivot Points Explained: Calculation Formula, Reading the Seven Levels, and Intraday Trading

Pivot Points are a technical tool that turns the previous period's high, low, and close into a set of support and resistance reference lines for the current period; the classic form consists of the central pivot P plus three resistance levels (R1–R3) and three support levels (S1–S3) — seven horizontal lines in total. The tool dates back to the era of exchange floor traders: before the open, they would run the previous day's figures through a fixed formula to know the day's key prices in advance — levels that stayed put all session and that anyone could reproduce. Objective, simple, and known ahead of time, Pivot Points remain one of the most widely used support and resistance frameworks in intraday trading.
Most support and resistance is drawn by hand, and where the lines go varies from trader to trader. Pivot Points replace that judgment with a fixed formula: the same formula applied to the same data gives everyone identical lines. That is both the tool's limitation and its power — with enough traders watching the same set of prices, those levels tend to become the session's contested battlegrounds, tested again and again.
This article covers the calculation formula with a worked example, three common ways to use the levels, the Fibonacci, Camarilla, and other variants, the time-zone and closing-price caveats specific to forex, and how to display Pivot Points in MT4/MT5.
- The central pivot P = (previous high + low + close) ÷ 3, with R1–R3 projected above and S1–S3 below — seven reference lines that stay fixed for the whole period.
- Three common uses: read the session's strength from where price sits relative to P, treat each level as a zone to watch for reactions, and use the next level as a reference for targets and risk.
- Pivot Points are computed only from the previous period's completed data and never move during the current period — objective and known in advance, which is their biggest difference from most real-time indicators.
- Variants include Fibonacci, Camarilla, Woodie, and DeMark, differing in the coefficients and formulas used to project the levels.
- Forex trades around the clock, so where the "day" is cut changes the numbers: platforms with different daily cuts produce slightly different pivots. Staying consistent within one data source is what matters.
- MT4/MT5's standard built-in indicator list has no classic Pivot Points; Titan FX provides its own pivot indicator (for Windows MT4/MT5) as a free download.
- 1. What Are Pivot Points?
- 2. How to Calculate Pivot Points: Formula and a Worked Example
- 3. How to Use Pivot Points: Three Common Approaches
- 4. Types of Pivot Points: Classic, Fibonacci, Camarilla, Woodie, and DeMark
- 5. Caveats When Using Pivot Points
- 6. Setting Up and Displaying Pivot Points in MT4/MT5
- 7. Pivot Points FAQ
- 8. Conclusion
1. What Are Pivot Points?
Pivot Points are a set of horizontal reference lines derived from three prices of the previous period — the high, the low, and the close. In the middle sits the central pivot P; above it, in order, are the resistance levels R1, R2, and R3; below it, the support levels S1, S2, and S3. The "previous period" is usually the prior trading day, but feeding in the prior week or month produces weekly and monthly pivots for larger timeframes.
The tool's origin is thoroughly practical. Before electronic trading, floor traders needed to know which prices mattered before the session opened, so they plugged the previous day's numbers into a formula and drew the day's map in advance. The habit survives to this day, and it makes Pivot Points one of the very few technical references that are fully determined before the open and never move during the session.
That immobility is precisely the value. Most indicators shift in real time with price; Pivot Points work like a ruler laid down in advance — you can tell at a glance which level price has climbed to or fallen through. And because the formula is public and everyone's math agrees, these prices tend to attract broad attention, getting tested repeatedly as intraday battlegrounds.
2. How to Calculate Pivot Points: Formula and a Worked Example
The classic (Floor) pivot formulas are as follows, where H, L, and C are the previous period's high, low, and close:
- ① Central pivot: P = (H + L + C) ÷ 3
- ② First level: R1 = 2P − L; S1 = 2P − H
- ③ Second level: R2 = P + (H − L); S2 = P − (H − L)
- ④ Third level: R3 = H + 2 × (P − L); S3 = L − 2 × (H − P)
Let's run one set of numbers. Suppose yesterday's EUR/USD printed H = 1.1080, L = 1.0980 (a 100-pip range), and C = 1.1051:
| Level | Substitution | Result |
|---|---|---|
| R3 | 1.1080 + 2 × (1.1037 − 1.0980) | 1.1194 |
| R2 | 1.1037 + 0.0100 | 1.1137 |
| R1 | 2 × 1.1037 − 1.0980 | 1.1094 |
| P | (1.1080 + 1.0980 + 1.1051) ÷ 3 | 1.1037 |
| S1 | 2 × 1.1037 − 1.1080 | 1.0994 |
| S2 | 1.1037 − 0.0100 | 1.0937 |
| S3 | 1.0980 − 2 × (1.1080 − 1.1037) | 1.0894 |
These numbers happen to divide evenly; real-world highs, lows, and closes rarely do. Keep full precision through the intermediate steps and round only at the end, to the instrument's minimum price increment — rounding midway lets the error compound from level to level.
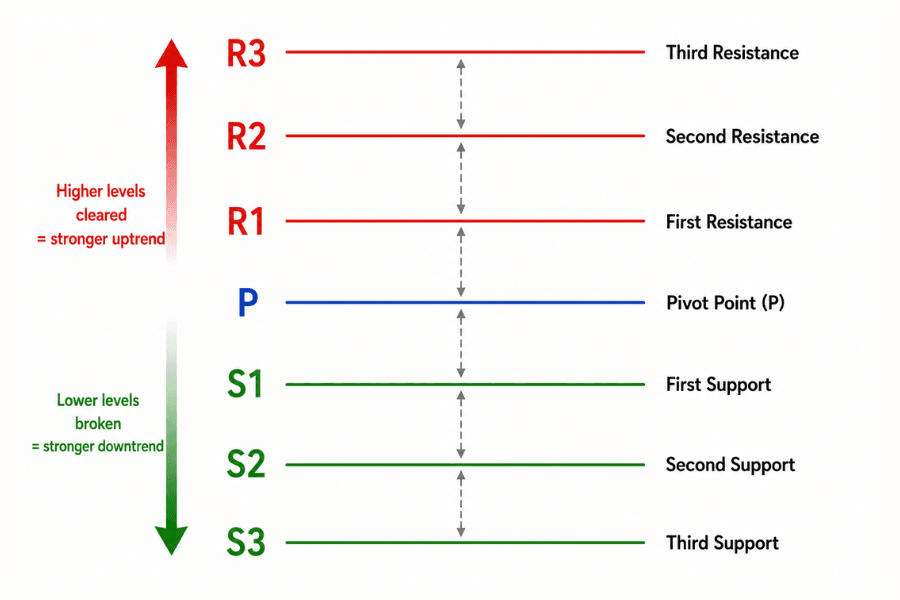
Two intuitions fall straight out of the formulas. First, the wider the previous period's range (H − L), the wider the spacing between levels tends to be — after a volatile day, the battlegrounds naturally sit farther apart. Second, P leans toward whichever end of the range the close settled at, reflecting which side had the upper hand in the previous period.
3. How to Use Pivot Points: Three Common Approaches
Approach 1: Read the session's tone — which side of P is price on?
The central pivot P is the dividing line for the current period's strength. If price spends the session mostly above P, the short-term tone reads as firm, and long setups deserve priority attention; mostly below P reads as weak. When price keeps crossing P without holding either side, direction is unclear — at least for now, P alone should not decide your bias. This check takes ten seconds, and it filters out a surprising number of counter-trend impulses.
Approach 2: Treat the levels as battlegrounds — bounces and breakouts
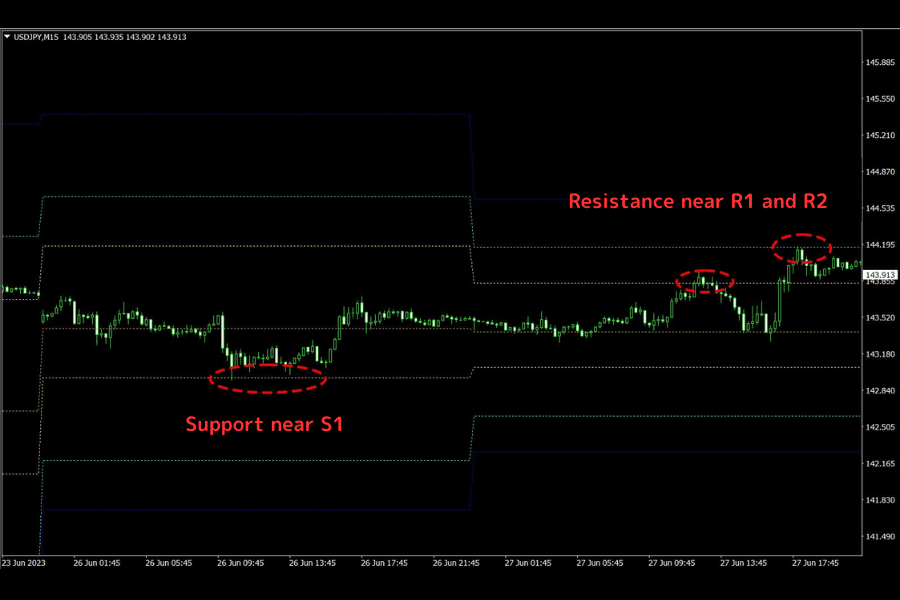
On range-bound days, price tends to rotate between R1 and S1, making these two levels the first places to watch for reversal reactions: as price approaches R1, watch whether it stalls; near S1, watch whether the decline dries up — and only trade the rotation once a signal appears. On trending days, price holds above R1 and pushes on toward R2 and R3 (or breaks S1 and heads straight for S2 and S3) — the levels then switch roles from "reversal references" to "milestones for the trend." Telling which kind of day you are in is the precondition for using pivots well, and it is why the tool has long been a favorite of day trading and scalping traders: the levels are explicit, and entries and exits have something objective to lean on.
Approach 3: Objective anchors for targets and stops
Once in a position, the next pivot level is a ready-made target reference: buying near S1, the first target is P and the second is R1. The stop, however, need not be mechanically tied to "one level further down" — the distance from S1 to S2 may not fit your risk budget at all. Anchor the stop where your entry thesis fails instead: for example, if price breaks S1 and settles below it, that is the exit signal for a long taken at S1. Using pre-computed levels as anchors is far more disciplined than the in-the-moment feeling that "this looks about right."
4. Types of Pivot Points: Classic, Fibonacci, Camarilla, Woodie, and DeMark
Beyond the classic formula, four variants see regular use. They differ in how the levels are projected and what they emphasize:
| Variant | Calculation | Emphasis |
|---|---|---|
| Fibonacci | Projects levels at 0.382, 0.618, and 1.000 times the prior range around P | Uses the same Fibonacci ratios, so traders at home with Fibonacci tools adapt quickly |
| Camarilla | Centers the levels on the close with smaller coefficients, placing S/R close to current price | Tight spacing and frequent touches: inner levels for intraday fading, a break of the outermost levels flips the read to trend continuation |
| Woodie | P = (H + L + 2C) ÷ 4, doubling the close's weight | Puts extra emphasis on where the previous period settled |
| DeMark | A conditional formula keyed to the open-close relationship, producing R1/S1 only | One key pair of levels, deliberately minimal |
Every variant has its advocates, but the guiding principle is to master the classic version first; once you understand how price interacts with the levels, switch by style if you wish. Avoid stacking several pivot sets on one chart — turn seven lines into twenty and the reference value collapses toward zero. Note also that platforms implement Woodie, DeMark, and other variants slightly differently, so check which formula an indicator actually uses before relying on it.
5. Caveats When Using Pivot Points
① In forex, how the "day" is cut decides the numbers. The forex market trades around the clock, so where the daily candle closes depends on your platform's server time zone; the common convention places the cut at the New York close (5 p.m. Eastern Time). Platforms with different daily cuts produce different pivot values — neither is "wrong." What matters is staying consistent within one data source, and understanding that someone else's pivots may not match yours exactly.
② Big days steamroll the levels. In one-way moves driven by major data or events, price can break level after level, and even R3 or S3 is no guaranteed stopping point. Pivot Points earn their keep on normal-volatility days; when the session's character changes, downgrade their weight first, and after a breakout, run it through a false breakout filter before deciding whether to follow.
③ Confluence gives a level substance. Where a pivot level coincides with other sources of support and resistance — prior swing highs and lows, moving averages, round numbers — it deserves priority over any isolated line. Titan FX's Key Support and Resistance Levels tool lists pivot points, recent highs and lows, and key prices from several other methods side by side, which makes the pre-open check for "levels with company" quick work.
④ Use it as a map. Pivot Points mark where price may react; they guarantee nothing about the direction of the reaction. What to do once price arrives still depends on the candles and the market state at that moment — treating "level reached" as "trade entered" is the classic way beginners lose money with pivots.
6. Setting Up and Displaying Pivot Points in MT4/MT5
Classic Pivot Points are not part of MT4/MT5's standard built-in indicator list — no ready-made Pivot Points appear under "Insert" → "Indicators" in any category. Titan FX fills the gap with its in-house pivot indicator (Titan_pivot), available for Titan FX's Windows MT4/MT5. By default it uses the previous day's (D1) data to draw PP and the R1–R3, S1–S3 levels automatically, sparing you the manual math; see the official page for the download and installation steps:
Pivot Display Indicator for MT4/MT5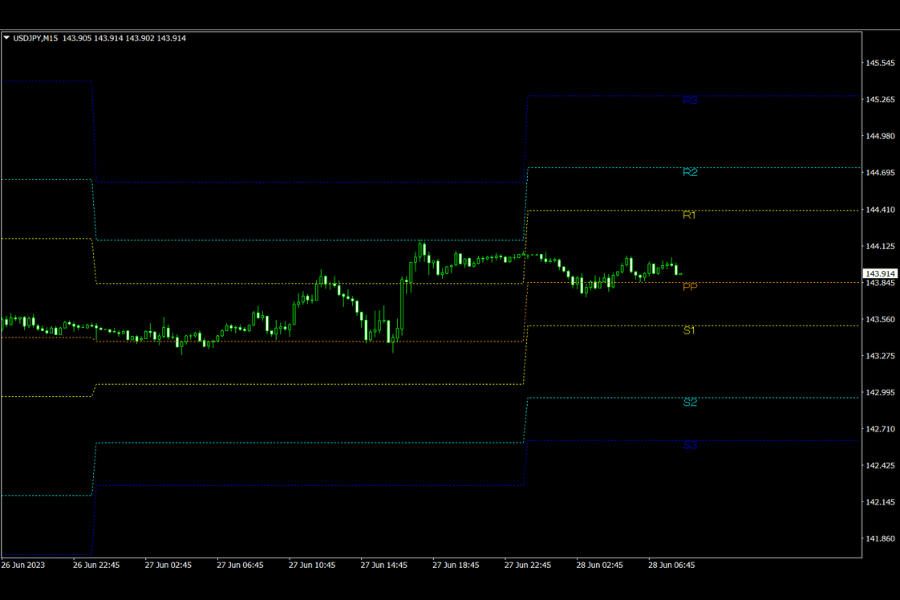
Two supplementary options: the "Free Indicators" folder in the Navigator panel of Titan FX's MT5 build ships with pivot-related tools such as Pivot Channel, Camarilla Channel, and DeMark Channel, ready to load; and since the classic formula needs only three numbers from the previous period, computing the levels by hand and placing horizontal lines takes barely a minute.
To browse the other custom indicators Titan FX provides, see the page below.
All Custom Indicators7. Pivot Points FAQ
Q1: When do Pivot Points update? Do they move during the session?
They are recalculated once at the start of each new trading day (or week, or month) and then stay fixed for the whole period. Because only the previous period's completed high, low, and close go into the math, no amount of current-period movement shifts the lines. That "determined in advance, fixed all session" property is the point of the tool.
Q2: Which time zone's close should forex pivots use?
Convention treats the New York close as the boundary of the forex trading day, but the actual numbers depend on your platform's server-side daily cut. Platforms that slice the "day" differently will print somewhat different pivots. There is no need to hunt for the single "correct" answer — consistency within one platform is enough.
Q3: How do Pivot Points differ from support and resistance drawn by hand?
Pivot Points come from a fixed formula: objective, repeatable, identical for everyone. Hand-drawn support and resistance comes from reading prior swings and price behavior: subjective, but closer to the market's actual structure. The two sources complement each other — where a computed level and a hand-drawn line coincide belongs on the session's priority watch list.
Q4: Which variant should I choose?
Master the classic version first. Its formula is simple and its structure intuitive, which makes it the natural starting point for understanding how price interacts with the levels. After that, switch by style if you like — Camarilla for tight intraday rotation, the Fibonacci version if you already work within the Fibonacci framework. One set at a time; stacked pivot sets only interfere with each other.
Q5: Are Pivot Points intraday-only?
Daily pivots mainly serve intraday trading, but the same formulas accept the prior week's or month's data, yielding weekly and monthly pivots as higher-timeframe references for swing trading. When daily, weekly, or monthly pivots cluster in the same area, that price zone carries reference levels from multiple timeframes at once and deserves extra attention.
Q6: Price rarely reaches R3 or S3 — do those levels still matter?
Yes. The fact that R3/S3 usually go untouched is exactly what makes the days they are reached unusual — typically strongly trending or event-driven sessions. Their role then is a warning: the day's move has already far exceeded the norm, so fading it calls for extra caution, while trend-side positions can treat them as a reference target for the final stretch.
8. Conclusion
Pivot Points trade three prices from the previous period for seven lines that never move during the current one: P sets the tone, and R1–R3, S1–S3 mark out the battlegrounds. The tool predicts no direction — it writes "these are today's prices to watch" onto the chart in advance, and that objectivity and certainty are why intraday traders have kept it within reach for decades.
Three things make it work: tell whether the day is range-bound or trending, so each level plays its role in the right script; cross-check pivot levels against other evidence instead of leaning on any single line; and remember that reaching a level is only an alert — the final call on entries and exits belongs to price action at that moment and to the risk rules you wrote down beforehand.
Further Reading
- Fibonacci Retracement Guide: Sequence, Drawing, Pros & Cons
- Trendlines: How to Draw Them, Judge Validity, and Confirm Breakouts
- How to Read Candlestick Charts: A Comprehensive Guide to 20 Candlestick Patterns and Market Predictions
- How to Use Moving Averages (MA) in Trading
- Bollinger Bands Complete Guide: Principles, Standard Deviation, Formula, Pros & Cons and MT4/MT5 Plotting
Titan FX Research Team. We cover a broad set of financial instruments — foreign exchange, commodities (crude oil, precious metals, agricultural products), equity indices, US equities, and digital assets — producing practical, research-backed educational content for traders.
Primary Sources (by Category)
- Theory: John J. Murphy, Technical Analysis of the Financial Markets (support and resistance chapters); the floor-trader pivot formulas in their common forms (Classic/Fibonacci/Camarilla/Woodie/DeMark)
- Platform and tools: Titan FX's Titan_pivot indicator (Windows MT4/MT5) and the Key Support and Resistance Levels tool; MetaQuotes MT4/MT5 platform documentation
- Market data: Titan FX price feeds and intraday volatility data