

Multiple Time Frame Analysis: How to Choose Timeframes and Trade Top-Down

An instrument can be rising on the daily chart while falling on the 1-hour chart. If you only watch one timeframe, it's easy to mistake a short pullback in a larger trend for a reversal. Reading the timeframes together makes it easier to tell whether a decline is just a pullback or whether the trend is really changing.
This guide covers how to choose timeframes, how to read them from the top down in three steps, what to do when they disagree, and how to check each timeframe's direction with MT5 and Titan FX tools.
- Multiple time frame analysis uses a higher timeframe for direction, a middle timeframe for location, and a lower timeframe for entry
- Choose timeframes to fit your trading style. Two or three are usually enough, and adjacent timeframes are often 4 to 6 times apart
- When the higher timeframe is rising and the lower one is falling, it may be a pullback. Wait for the lower timeframe to turn back up before entering with the trend
- In trend trading, the higher timeframe usually takes priority when they disagree. If it has no clear direction, stay out
- The Multi-Timeframe Trend Checker lists each timeframe's direction on your chart, and Moving Average Analysis helps you screen instruments with a heatmap. Either way, confirm the location on the chart before you enter
- 1. What Is Multiple Time Frame Analysis?
- 2. How to Choose Timeframes for Your Trading Style
- 3. How to Do Top-Down Analysis in Three Steps
- 4. What If the Higher and Lower Timeframes Disagree?
- 5. How to View Multiple Timeframes in MT5
- 6. Check Every Timeframe at Once With a Trend Panel
- 7. Screen Instruments With Moving Average Analysis
- 8. Common Multiple Time Frame Analysis Mistakes
- 9. FAQ
- 10. Conclusion
1. What Is Multiple Time Frame Analysis?
A candlestick chart looks different on different timeframes. Higher timeframes show the overall direction more clearly, while lower timeframes show entry and exit locations in more detail.
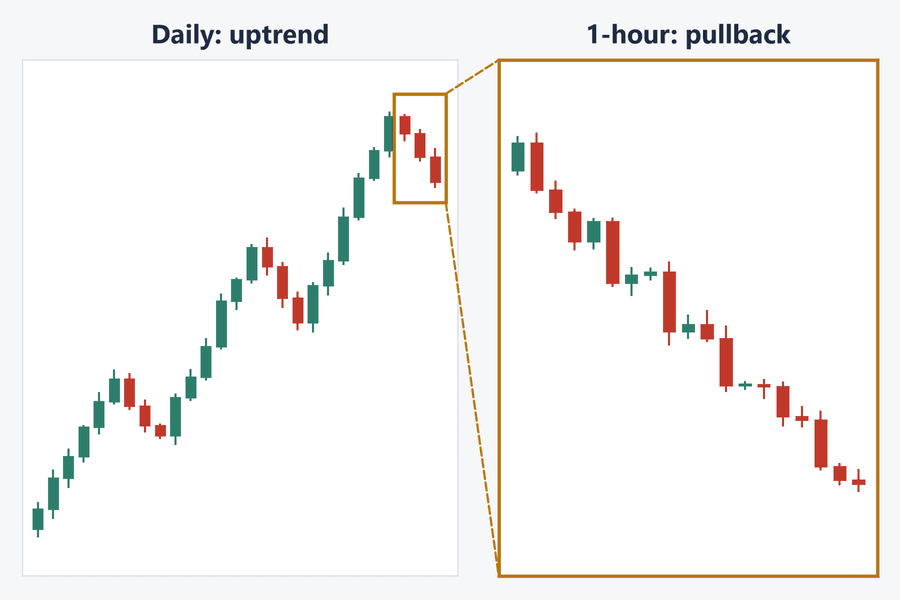
Multiple time frame analysis combines these two views. A well-known example is Alexander Elder's Triple Screen: it uses a long timeframe to see the main trend, an intermediate timeframe to wait for a pullback, and a short timeframe to decide the entry. This guide covers the more general approach of using higher, middle, and lower timeframes.
The method helps in situations like these:
| Situation | What to do |
|---|---|
| You're about to enter and want to be sure you aren't fighting the larger trend | Check the direction on a higher timeframe |
| A lower timeframe shows a signal, but you aren't sure it's worth taking | See whether the signal agrees with the higher timeframe |
| You're in a trade, price pulls back, and you're unsure whether to exit | Check whether the trend on the higher timeframe is still intact |
| You want to pick the clearest trends from several instruments | Look for instruments whose timeframes point the same way |
2. How to Choose Timeframes for Your Trading Style
The right combination depends on how long you plan to hold a trade. Common combinations include:
| Trading style | Higher: direction | Middle: location | Lower: entry |
|---|---|---|---|
| Scalping | 1-hour | 15-minute | 5-minute |
| Day trading | 4-hour | 1-hour | 15-minute |
| Swing trading | Daily | 4-hour | 1-hour |
| Position trading | Monthly | Weekly | Daily |
These are only starting points. You can adjust them to the instrument and the hours you trade. Two principles help:
-
Keep adjacent timeframes apart: a gap of 4 to 6 times is common, but it isn't a hard rule. The 15-minute and 5-minute charts in the table are only 3 times apart. With just a 2x gap, such as 15-minute and 30-minute, the two charts look very similar
-
Don't use too many: two or three are usually enough. The more timeframes you watch, the more conflicting signals you get, and the harder it becomes to decide
3. How to Do Top-Down Analysis in Three Steps
Always work from the higher timeframe down. If you start on the lower timeframe and then look up, it's easy to pick only the chart that supports what you already think.
-
① Use the higher timeframe for direction: check whether highs and lows are rising or falling and whether price is above or below the moving average. This step only decides whether to look for longs, shorts, or nothing
-
② Use the middle timeframe for location: find a price for a with-trend entry, such as support on a pullback, a trendline, or a moving average. If price hasn't reached it, wait
-
③ Use the lower timeframe for entry: once price reaches that location, switch to the lower timeframe and wait for a signal, such as a candle that stops the decline or a break above a minor high
Example: hypothetical figures. A swing trader looks at EUR/USD
Higher timeframe (daily): highs and lows keep rising, so the direction is long
Middle timeframe (4-hour): price pulls back to support near 1.1000, the location you wanted
Lower timeframe (1-hour): price stops falling above support and breaks a minor high, so you buy at 1.1010
Stop and target: the stop goes below support at 1.0975, a risk of 35 pips. The target is the previous high on the daily chart at 1.1115, a potential gain of 105 pips, for a risk-reward ratio of about 1:3
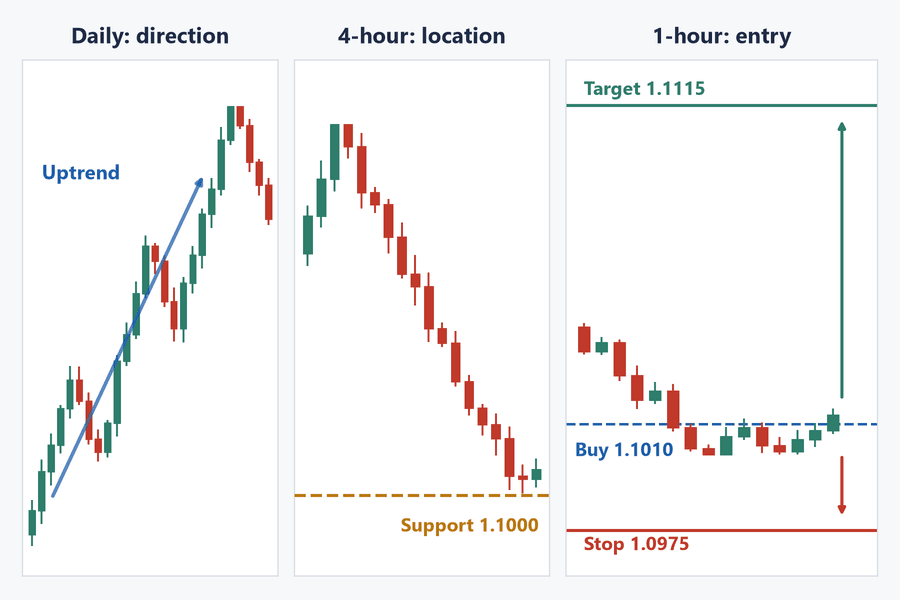
The lower timeframe lets you pinpoint your entry more precisely, which may also shorten your stop loss distance. If you entered directly from the daily chart in this example, the stop would usually have to sit farther away, so the same risk amount would buy a smaller position.
Even so, base your stop on price structure and volatility. If you place it too close just to improve the risk-reward ratio, normal price swings can easily take you out.
4. What If the Higher and Lower Timeframes Disagree?
Timeframes often disagree. In trend trading, the higher timeframe usually takes priority. Treat a move against it on the lower timeframe as a possible pullback or rally, and wait for price to confirm before you enter.
| Higher timeframe | Lower timeframe | What it may mean | With-trend approach |
|---|---|---|---|
| Up | Up | Aligned | Wait for a pullback to buy; don't chase |
| Up | Down | Pullback in an uptrend | Buy after the lower timeframe turns back up |
| Down | Down | Aligned | Wait for a rally to sell; don't chase |
| Down | Up | Rally in a downtrend | Sell after the lower timeframe turns back down |
| No direction | Either | The higher timeframe is ranging | Stay out or switch to a range approach |
Watch out if the lower timeframe keeps moving against the higher one for a long time, because the larger trend may be changing. In an uptrend, once price breaks the previous low on the higher timeframe, reassess the direction and stop treating the decline as a pullback.
5. How to View Multiple Timeframes in MT5
Open three charts of the same instrument in MT5 and set them to daily, 4-hour, and 1-hour. Then choose Tile Vertically from the Window menu to arrange them on one screen, and you can see all three timeframes at once.
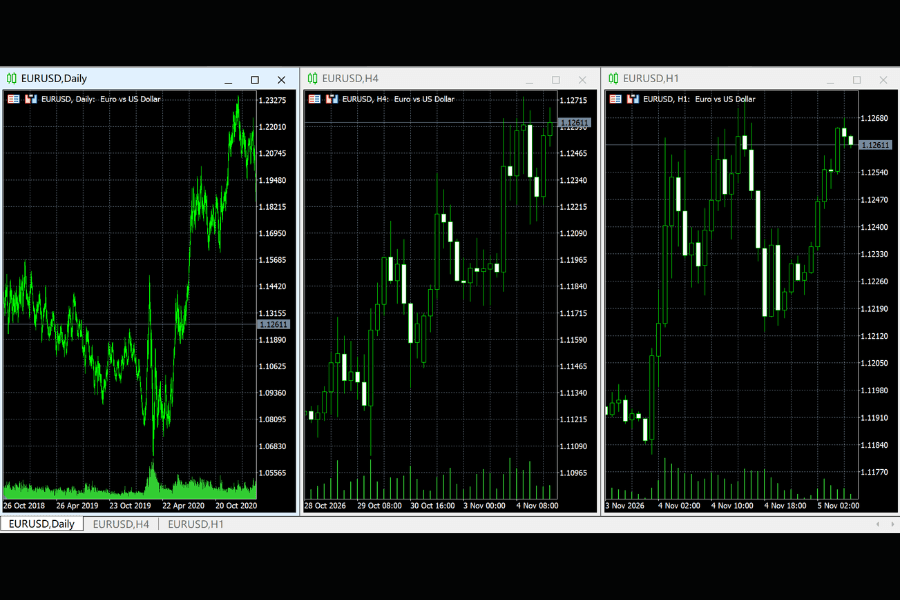
You can switch timeframes with the M1, M5, M15, M30, H1, H4, D1, W1, and MN buttons on the toolbar. Adding the same moving average to all three charts makes their directions easier to compare.
If you're short on screen space, you don't have to display all three. You can judge the direction on the higher timeframe, then switch to the lower one to look for an entry.
6. Check Every Timeframe at Once With a Trend Panel
Three charts take up a lot of screen, and you still have to read each one. The Titan FX Multi-Timeframe Trend Checker (Titan_Multi-Time_Trend_Panel) adds a small panel to your chart that lists the trend on each timeframe with arrows and colors: ↑ for up, ↓ for down, and → for ranging.
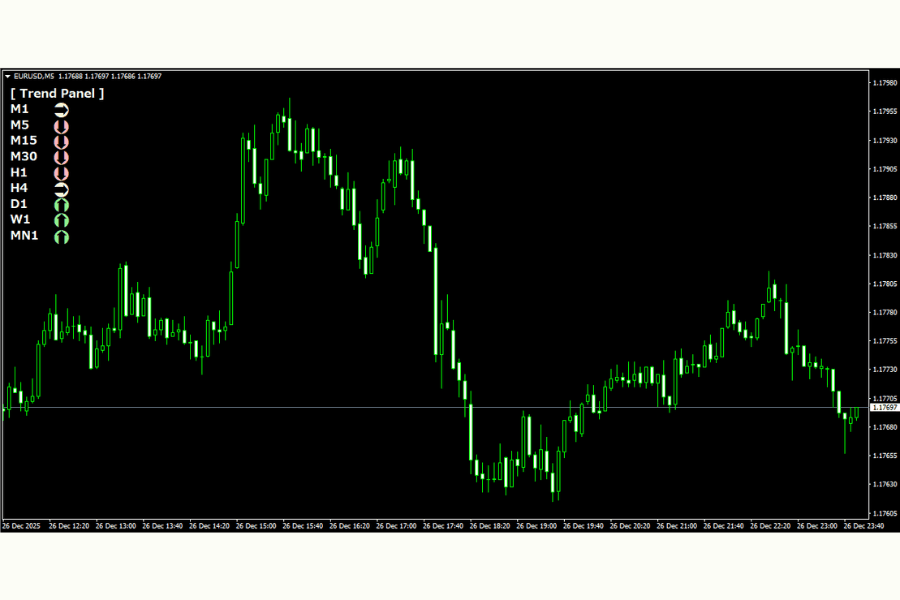
It judges direction with short-term and medium-term moving averages. The defaults are 10-period and 20-period exponential moving averages.
The panel lists nine timeframes, from M1 to MN1. Just read the rows you use, such as D1, H4, and H1 for swing trading.
Using D1, H4, and H1 as an example, you can read the panel like this:
-
All three point the same way: only consider trades in that direction. Short-term traders can then switch to M5 or M15 and enter on a pullback or rally
-
D1 and H4 agree, but H1 is opposite: this may be a pullback or rally. Wait for H1 to turn back before entering
-
D1 and H4 disagree: the larger direction isn't clear, so stay out
In the image above, D1 is ↑, H4 is →, and H1 is ↓. That's the third case, so a swing trader would stay out.
The arrows only show direction. They don't tell you where support and resistance are, so you still need the chart to find your entry location.
This indicator works only on the Windows versions of Titan FX MT5 and MT4.
View the Multi-Timeframe Trend Checker7. Screen Instruments With Moving Average Analysis
If you haven't decided which instrument to watch, start with Titan FX Moving Average Analysis. You can check each instrument's direction in turn without opening MT5.
Its heatmap shows how far price is from the 20-period moving average (the deviation rate) for one instrument on four timeframes: 5-minute, 15-minute, 30-minute, and 1-hour. A dropdown lets you switch instruments.
Blue means price is above the moving average, and red means it's below. The darker the color, the farther price is from the average.
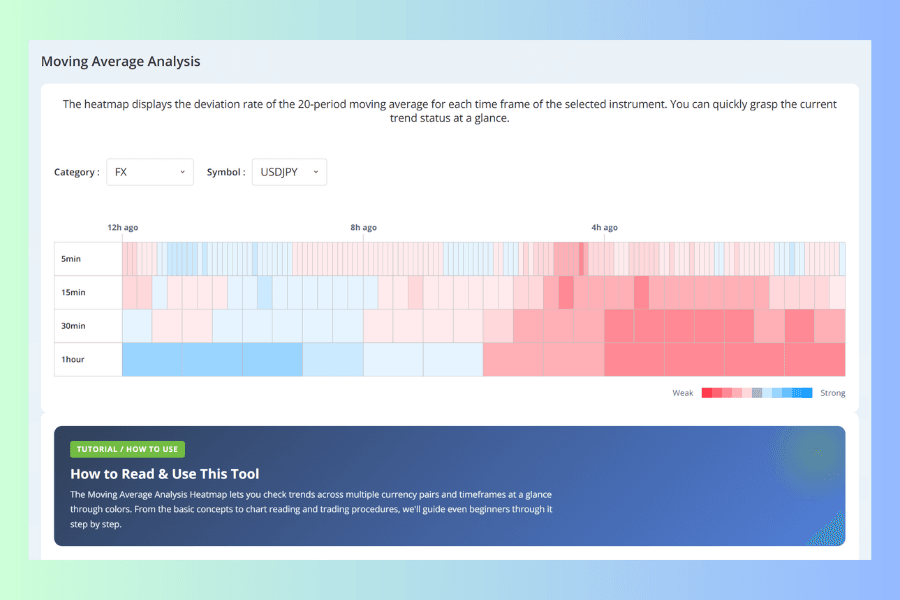
Start by reading down the four timeframes at the same point in time:
-
All four are blue or all four are red: price is on the same side of the 20-period average on every timeframe, so you can treat the direction as aligned for now. Very dark colors mean price is far from the average, so avoid chasing it
-
30-minute and 1-hour are blue, but 5-minute is red: this may be a short pullback in an uptrend. With the colors reversed, it may be a rally in a downtrend
-
Mostly white: price is close to the average with no clear direction, so stay out
The tool only covers timeframes up to 1 hour, so it suits day trading best. It can show you which instruments are worth a look, but you still need to confirm the location and signal on the chart before entering.
For swing trading, check the daily and 4-hour timeframes on the chart or with the indicator in Section 6.
Open Moving Average Analysis8. Common Multiple Time Frame Analysis Mistakes
-
Watching too many timeframes: with five or six charts open, you can always find one that supports your view. Decide which ones you'll use in advance and don't add more mid-trade
-
Checking direction but not location: a rising higher timeframe doesn't make every price a good buy. If price is already far from support, your stop has to be wider and your risk-reward ratio gets worse
-
Using the higher timeframe to excuse a losing trade: when a short-term trade nears its stop, removing the stop and telling yourself "the daily is still rising" means changing your plan on the fly. Stick to the stop you set when you entered
-
Treating an open candle as final: higher-timeframe candles take a long time to close and can change shape until they do. Base your read of direction on closed candles
9. FAQ
Q1. If the higher and lower timeframes give opposite signals, should I avoid trading?
Not necessarily. Counter-trend trading is a strategy too, but profit potential is usually smaller and the failure rate may be higher, so targets need to be closer and stops tighter. Beginners will usually find trend following easier to start with.
Q2. How often should I check the higher timeframe?
As often as its candles close. If your higher timeframe is daily, check once a day; if it's 4-hour, check every 4 hours. There's no need to keep changing your view before the candle closes.
Q3. Which indicators work with multiple time frame analysis?
A common approach is a moving average for direction on the higher timeframe, with RSI, MACD, or candlestick signals for entries on the lower one. You don't need the same indicators on every timeframe. Each timeframe only has to do one job: direction, location, or entry.
Q4. Do I have to use three timeframes?
No. Two also work, such as the daily chart for direction and the 4-hour chart for the entry location. The advantage of three is that you can judge direction, location, and entry separately.
10. Conclusion
Multiple time frame analysis follows a simple order: higher timeframe for direction, middle for location, lower for entry. Choose timeframes that fit your style; two or three are enough.
In trend trading, when the timeframes disagree, the higher one usually takes priority, and you wait for the lower one to turn back before entering. If price breaks the previous low or high on the higher timeframe, reassess the direction.
Further Reading
Titan FX Research Team. We cover a broad set of financial instruments — foreign exchange, commodities (crude oil, precious metals, agricultural products), equity indices, US equities, and digital assets — producing practical, research-backed educational content for traders.
Primary Sources (by Category)
- Titan FX tools: Titan_Multi-Time_Trend_Panel indicator page; Titan FX Research Moving Average Analysis and its user guide (accessed November 5, 2026)
- Technical analysis sources: Alexander Elder's Triple Screen. Timeframe combinations and ratios are common rules of thumb in technical analysis