

Smart Money Concepts (SMC) Explained: Order Blocks, Fair Value Gaps and Liquidity Sweeps
SMC traders use price to infer where large players may have bought or sold. They decide on a direction from market structure, mark the zones where price is likely to react, and wait for price to come back to those zones before looking for an entry.
This guide explains the four core concepts with diagrams, walks through one complete long trade that ties them together, and shows how to plot the zones automatically with Titan FX's MT5 indicators.
- SMC is a framework that grew out of the trading community, built around market structure, order blocks, FVGs and liquidity
- A BOS breaks a swing point in the direction of the trend; a CHoCH is the first break against the trend and an early sign that it may be changing
- An order block is the zone of the last opposite candle before a strong move, and it only counts if that move went on to make a BOS
- An FVG is the price gap left between three candles during a fast move, and price may later return to it
- Stops tend to cluster above recent highs and below recent lows; a quick push through those levels that snaps back is a liquidity sweep
- 1. What Are Smart Money Concepts (SMC)?
- 2. Market Structure: BOS and CHoCH
- 3. What Is an Order Block?
- 4. What Is a Fair Value Gap (FVG)?
- 5. Liquidity and Liquidity Sweeps
- 6. An SMC Trade, Step by Step: A Long Example
- 7. Plotting SMC Zones with Titan FX MT5 Indicators
- 8. Limitations of SMC
- 9. FAQ
- 10. Conclusion
1. What Are Smart Money Concepts (SMC)?
In SMC, "smart money" usually means the capital of institutions such as banks and funds. Their orders are so large that filling them all at once would push the price too far, so they tend to buy or sell in pieces within a price range.
SMC holds that this large-scale buying and selling leaves recognizable shapes on the chart: the starting point of a strong rally or sell-off, the empty space left by a fast move, and the highs and lows where stop orders are likely to sit. Traders use these shapes to estimate where price may react next. All of this is inference from price; a chart cannot tell you who actually placed the orders.
| Concept | What it shows |
|---|---|
| Market structure | Trend direction |
| Order block (OB) | Where a big move began |
| Fair value gap (FVG) | Gap left by a fast move |
| Liquidity | Where stops cluster |
Each concept has its own job. Market structure tells you whether to look for longs or shorts, order blocks and FVGs narrow down the prices worth waiting for, and liquidity helps you tell a real breakout from a sweep.
SMC spread through trading communities, and there is no formal definition from an exchange or an academic body. Like price action trading, it focuses on price itself rather than on traditional indicators.
2. Market Structure: BOS and CHoCH
Market structure is made up of swing highs (peaks where a rally turns down) and swing lows (troughs where a decline turns up). In an uptrend, each swing high and swing low is higher than the one before; in a downtrend, each is lower.
SMC describes changes in structure with two kinds of breaks:
-
BOS (break of structure): price breaks the previous swing high in an uptrend, or the previous swing low in a downtrend, in the direction of the trend. It is usually read as trend continuation
-
CHoCH (change of character): price breaks the most recent significant swing point against the trend for the first time. In an uptrend, for example, a break below the previous swing low suggests the market's behavior may be starting to change
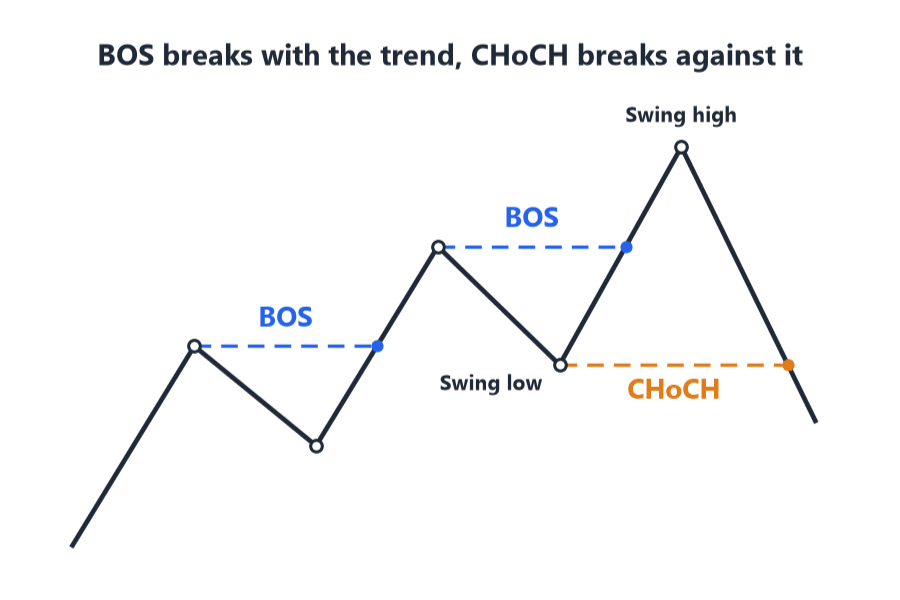
A CHoCH is only the first sign of a possible reversal. If price then makes a BOS in the new direction, the new trend becomes clearer.
A conservative rule is to require a candle close beyond the swing point and to ignore wicks that poke through and come back. Traders differ on whether wicks or closes count, so pick one rule and apply it consistently.
3. What Is an Order Block?
An order block (OB) is the price zone of the last opposite candle before a strong one-directional move. An opposite candle is one that closes in the other direction from the move that follows, such as the last bearish candle before a sharp rally.
The SMC reading is that institutions bought heavily at that candle, and price was pushed higher before all of their orders were filled. When price later returns to the zone, the remaining buy orders may be filled, which can support price.
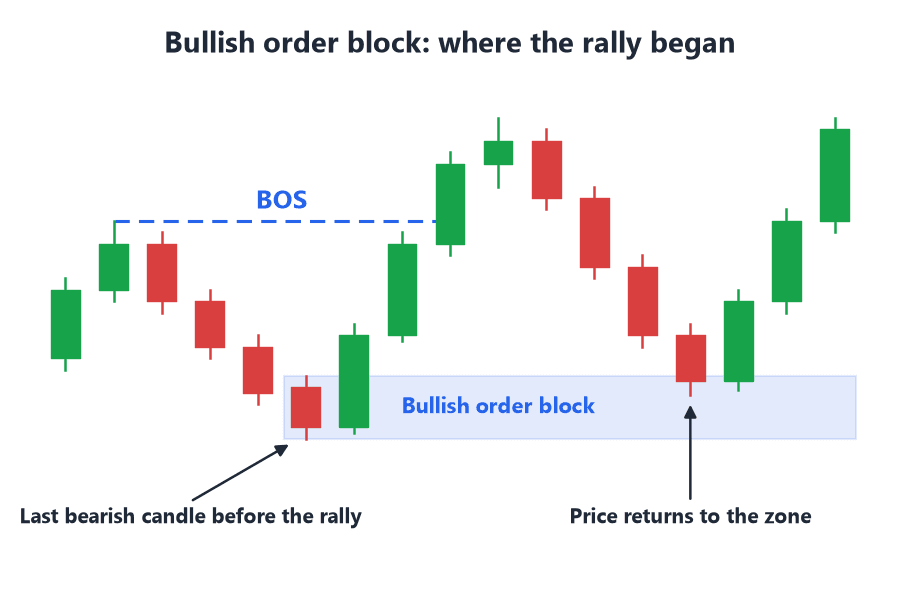
Bullish and Bearish Order Blocks
-
Bullish order block (demand): the last bearish candle before a strong rally. When price pulls back into this zone, it may find support again
-
Bearish order block (supply): the last bullish candle before a strong decline. When price rallies back into this zone, it may meet selling again
How to Mark the Zone
-
Full candle: use the high and low as the boundaries. The zone is wider, so price is more likely to reach it
-
Body only: use the open and close as the boundaries. The zone is narrower, so your stop loss can sit closer
Both methods are common. Choose one and stick with it so that your zones stay consistent.
What Makes an Order Block Valid
Not every bearish candle before a rally is an order block. Common filters include:
-
① A BOS follows: the move after the opposite candle breaks the previous swing high or low
-
② Price has not returned yet: many SMC traders consider the first return to an order block the most meaningful, since each later visit may leave fewer orders in the zone
-
③ It agrees with the higher-timeframe trend: look only at bullish order blocks in an uptrend and only at bearish order blocks in a downtrend
Retests and Invalidation
-
Retest: price comes back inside the order block. SMC treats this as the moment the leftover orders are being filled, and as the time to look for an entry
-
Invalidation: price closes through the far side of the order block, for example a close below the bottom of a bullish order block. The original idea no longer holds, and the zone is ignored from then on
The word "mitigation" is not used consistently. Some traders use it for price returning into an order block, while some indicators, including Titan_StructureMapper, use it for zones that price has already broken through. When you see the term, check which meaning is intended.
4. What Is a Fair Value Gap (FVG)?
A fair value gap (FVG) is the price range between three candles that does not overlap after a fast move. The middle candle is a large one, and when the ranges of the first and third candles do not touch, the empty space between them is the FVG.
| Type | Condition | Where it forms |
|---|---|---|
| Bullish FVG | Candle 1 high below candle 3 low | During a rally |
| Bearish FVG | Candle 1 low above candle 3 high | During a decline |
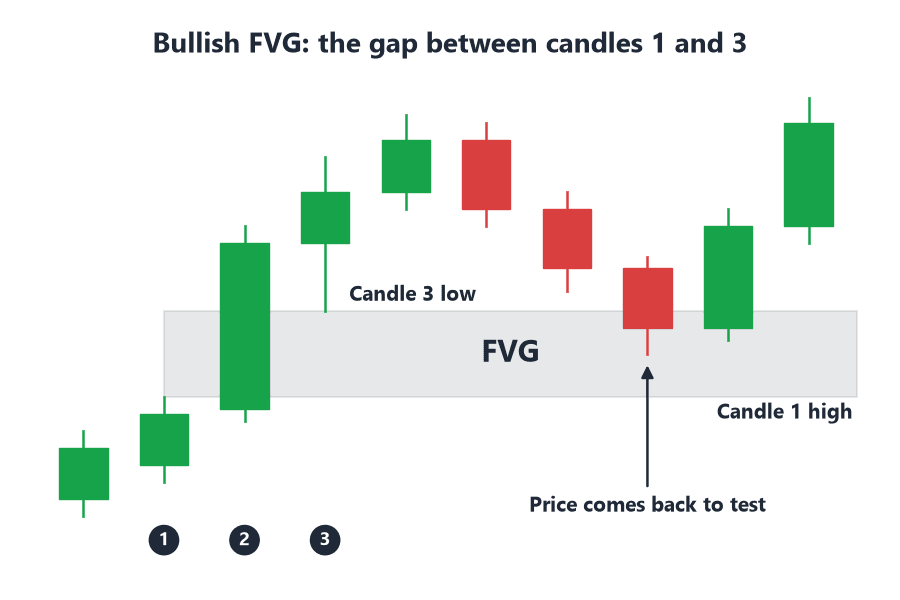
SMC treats an FVG as an imbalance created by a fast move and expects that price may come back to test it, so FVGs are often used as areas to watch for pullback entries.
An FVG is not the same as a price gap. A price gap is a range where no trading took place between two candles; an FVG is defined by three candles, and the large middle candle did trade through that range.
The start of a strong move often leaves both an order block and an FVG, and an area where the two overlap is usually seen as more significant. Not every FVG gets filled, though. In a strong trend, price can leave an FVG behind and keep going.
5. Liquidity and Liquidity Sweeps
In SMC, liquidity means the prices where stop losses and pending orders are likely to cluster. You cannot see the actual orders on a chart, so SMC infers these levels from where traders typically place their stops.
| Name | Typical location |
|---|---|
| Buy-side liquidity (BSL) | Above recent highs |
| Sell-side liquidity (SSL) | Below recent lows |
Short sellers often place stops above a recent high, and those stops become buy orders when triggered, which is why the area above a high is called buy-side liquidity. Long traders' stops sit below a recent low and become sell orders when triggered, so that area is sell-side liquidity. Equal highs and equal lows, where several swing points line up at almost the same price, and the previous day's high and low are thought to attract even more stops.
When price briefly breaks through one of these levels, triggers the stops and then quickly returns to its earlier range, SMC calls it a liquidity sweep. The move looks very much like a false breakout, is also known as stop hunting, and often appears at trend turning points or at the end of a pullback. A CHoCH that follows a sweep is often used as a reversal signal.
6. An SMC Trade, Step by Step: A Long Example
The schematic long trade below puts the four concepts together:
-
① Set the direction on a higher timeframe: on the 4-hour chart, highs and lows are rising and the latest rally broke the prior high (BOS). The structure is bullish, so you only look for longs
-
② Mark the zones: the last bearish candle before this rally is a bullish order block, and the rally also left an FVG. The two zones partly overlap
-
③ Wait for price to return: price pulls back into the order block, dips below a nearby minor low and quickly recovers. That dip swept the sell-side liquidity below
-
④ Confirm on a lower timeframe: on the 15-minute chart, price breaks above the latest minor swing high (CHoCH), showing that the short-term trend has turned up. Bullish reversal candlestick patterns can also serve as confirmation
-
⑤ Enter and manage risk: enter after confirmation, place the stop loss just below the bottom of the order block, and target the buy-side liquidity above the prior high
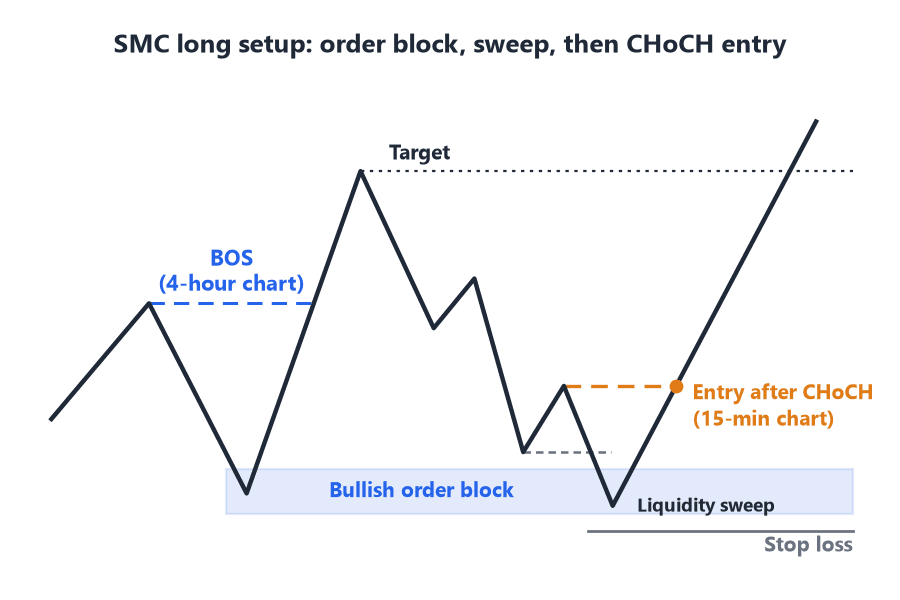
This example is a simplified diagram, and real charts rarely line up this neatly. Setting the direction on a higher timeframe and timing the entry on a lower one is the core of multiple time frame analysis. When the timeframes disagree, for example when a 4-hour bullish order block overlaps a 15-minute bearish one, the higher timeframe takes priority.
A short trade is the mirror image. With a bearish structure on the higher timeframe, look for a bearish order block or an FVG left by the decline, wait for price to rally into the zone and sweep the buy-side liquidity above, and enter after a CHoCH.
7. Plotting SMC Zones with Titan FX MT5 Indicators
Titan_StructureMapper: Order Blocks and FVGs
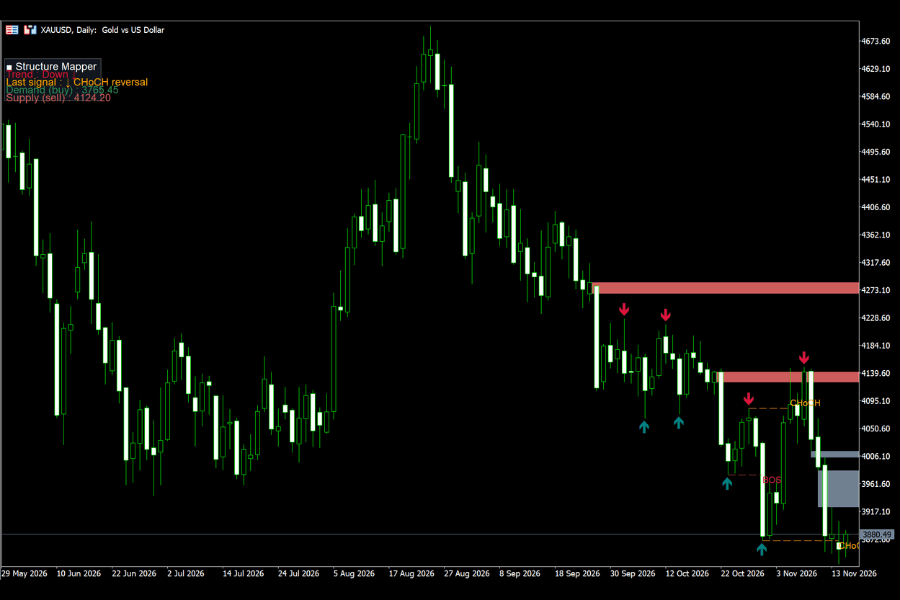
Titan_StructureMapper, Titan FX's indicator for MT4 and MT5, automatically marks swing highs and lows, BOS, CHoCH and order blocks. A summary panel in the top-left corner shows the current trend, the latest signal and the prices of the demand and supply zones. Green zones are bullish order blocks (demand) and red zones are bearish order blocks (supply).
FVGs are hidden by default. To show them, set "Fair value gaps" to true on the Inputs tab. By default, swings are detected using three candles on each side, and the indicator shows up to the two most recent zones of each type. Zones that price has already broken through are hidden automatically.
Titan_LiquiditySweepDetector: Liquidity Sweeps
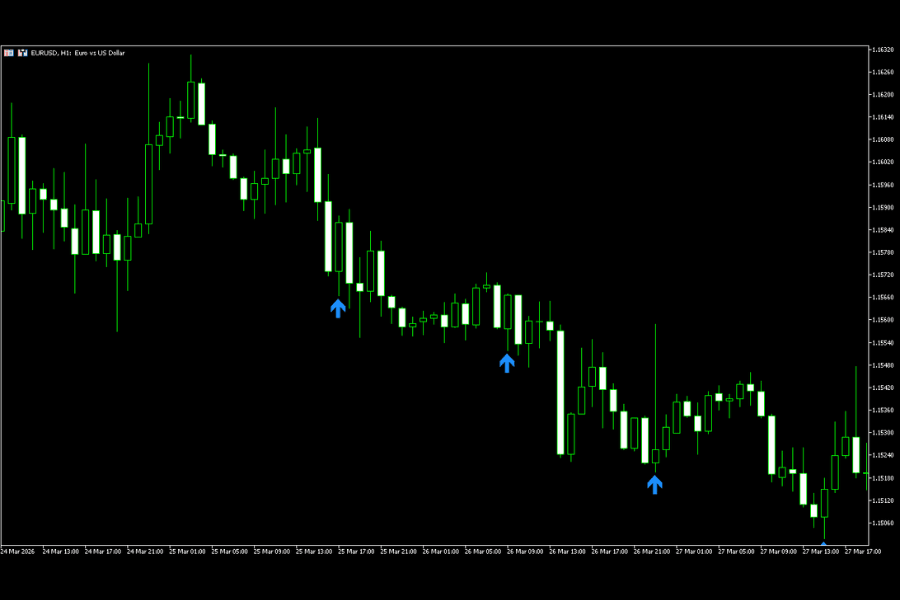
Titan_LiquiditySweepDetector uses recent highs and lows (20 bars by default) as reference levels. When price moves at least 1.0 pips beyond a level and then closes back inside the earlier range, the indicator draws an arrow on the chart: a down arrow when an upper wick is rejected and an up arrow when a lower wick is rejected.
An arrow is not a signal to enter right away. It tells you that the breakout may have failed, so read it together with market structure. The indicator runs only on the Windows versions of Titan FX MT4 and MT5.
8. Limitations of SMC
-
It is subjective: which candle counts as an order block and which high counts as a valid swing point varies from trader to trader
-
Hindsight makes it look easy: finding order blocks on a historical chart is simple, but spotting them in real time is much harder. Practice on a demo account or with historical charts before trading real money
-
You cannot verify institutional orders: "institutional footprints" are SMC's interpretation, and a chart cannot show who is actually buying or selling
-
A zone does not guarantee a reversal: order blocks and FVGs are only areas worth watching, and price can cut straight through them. Use a stop loss on every trade and limit the risk on each one
9. FAQ
Q1. What is the difference between SMC and price action?
Both analyze price itself. Price action focuses on candlestick patterns and key levels, while SMC uses order blocks, FVGs and liquidity to explain, from an institutional point of view, why price reacts at those levels.
Q2. How is an order block different from support and resistance?
Support and resistance is about how many times price has reacted at a level, and more reactions make a level more important. An order block is about where a strong move started, and it usually becomes less reliable once price has retested it.
Q3. What is the difference between an order block and an FVG?
An order block is the zone of the last opposite candle before a strong move. An FVG is the non-overlapping range between three candles in the middle of that move. They can appear separately or overlap, and an overlap is usually seen as more significant.
Q4. Is an order block still valid after price has touched it?
Once price returns to an order block, the zone has been tested, and many SMC traders treat it as less reliable. Whether it is fully invalid depends on whether price has closed through the far side of the zone.
Q5. Do fair value gaps always get filled?
No. An FVG is only an area price may return to. In a strong trend, price can leave the gap behind and keep moving, so an FVG should never be treated as guaranteed support or resistance.
Q6. Is SMC suitable for beginners?
The concepts are not hard, but applying them takes experience, and beginners tend to treat every opposite candle as an order block. Get comfortable with market structure and stop placement first, then practice on a demo account.
Q7. How do I show order blocks and FVGs in MT5?
MT5 has no built-in indicator for them. Titan FX clients can download Titan_StructureMapper, which marks order blocks automatically; FVGs can be turned on in the settings.
10. Conclusion
Smart Money Concepts reads price from an institutional point of view through four ideas: market structure, order blocks, FVGs and liquidity. BOS and CHoCH set the direction, order blocks and FVGs mark the zones to wait for, and liquidity helps separate real breakouts from sweeps.
These zones are areas worth watching, not guaranteed turning points. Confirm the direction on a higher timeframe, wait for price to return to the zone and for confirmation on a lower timeframe before entering, and use a stop loss on every trade.
Further Reading
- Trendlines: How to Draw Them and Confirm Breakouts
- Trend Following in Forex
- Breakout Trading Strategy
The financial markets research team at Titan FX. We produce educational content across a broad range of instruments, including forex (FX), commodities (crude oil, precious metals, agricultural products), equity indices, U.S. stocks, and crypto assets.
Primary Sources
- Indicator details: Titan FX indicator pages for Titan_StructureMapper and Titan_LiquiditySweepDetector (features and default settings)