
 Home
Home- Investment Guide: Strategies for Stocks, Forex, and Metals
- What Is Stop Hunting? Stop Clusters, Signs and Defenses
What Is Stop Hunting? Where Stops Cluster, How to Spot a Sweep, and How to Place Stops That Survive
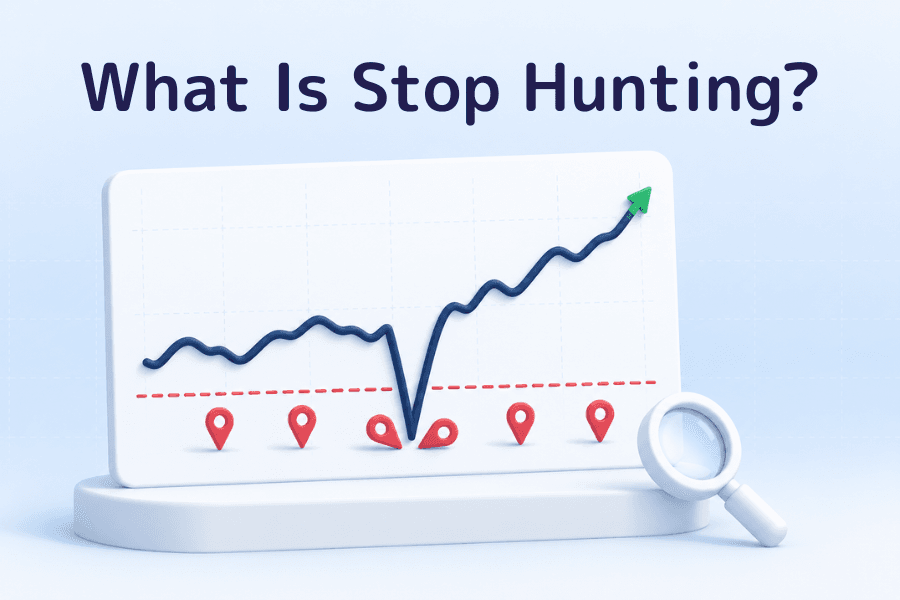
Stop hunting (also called a stop hunt, stop-loss hunting or a stop run) is a price move that briefly pushes through a level where many traders have placed their stop-loss orders, triggers those stops, and then quickly snaps back and heads the other way. It usually happens just beyond a prior high or low, a round number, or a support or resistance line. A stop-loss order becomes a market order once it is triggered, so the more stops sit at one price, the sharper the burst of movement once price breaks through it. The same move is often called a liquidity sweep.
For a trader, understanding stop hunts pays off in two ways. On defense, you stop placing your stop at the most obvious price, which cuts down how often it gets hit. On offense, a sweep of a stop cluster that snaps back can serve as one of your conditions for spotting a reversal. Both start from the same judgment: figuring out where stops are likely to be clustered.
This article explains what stop hunting is and where the term comes from, why it happens, the five places where stops tend to cluster, how to recognize a sweep, where to place a stop so it is less likely to be hunted, how to trade the reversal after a sweep, and the questions traders ask most often.
- A stop hunt is a move through a cluster of stop-loss orders that triggers them and then snaps back; it is also called a liquidity sweep
- Triggered stops execute at market, so a cluster firing at once amplifies short-term movement, but it does not guarantee a reversal
- Spot forex has no market-wide order book, so stop clusters can only be inferred from prior highs and lows, round numbers and similar levels
- The classic sweep is a long wick: price pierces a key level by a little, snaps back fast, and the candle closes on the original side
- Start your stop at the price where the trade idea fails, add an ATR buffer, and cut the lot size to match the distance; a wider stop is not automatically safer
- Pending Orders and Open Position Trends shows where Titan FX client orders cluster, but it cannot tell how many of them are stops
- 1. What Is Stop Hunting? Definition and Origin
- 2. Why Stop Hunts Happen: Stop Orders, Liquidity and Order Clustering
- 3. Where Do Stops Cluster? Five Places
- 4. How to Recognize a Stop Hunt: Three Signs and a USD/JPY Example
- 5. Where to Place a Stop So It Survives: Three Methods and a Tool
- 6. Turning It Around: How to Enter After a Sweep
- 7. Frequently Asked Questions About Stop Hunting
- 8. Summary
1. What Is Stop Hunting? Definition and Origin
A stop hunt is a price move: price pushes through a level where many traders keep their stop-loss orders, triggers them all at once, then returns to the previous range and keeps going the other way. The trader who got stopped out sees a stop that "happened to sit exactly at the low." The chart shows a long wick that pierced a key level and came back.
The name comes from the idea that someone is out there hunting retail traders' stops. Originally it described floor traders on an exchange pushing price to trigger their counterparties' stops. Today's forex market is a decentralized over-the-counter market with no single exchange, and nobody can see everyone's stops. The same move still happens every day, for reasons explained in section 2.
Stop hunting goes by several other names. Stop-loss hunting and stop run mean the same thing. Liquidity sweep and liquidity grab are the terms used in order-flow analysis in recent years, and they describe the same event.
A false breakout describes the same move from the angle of chart patterns. The difference between the two is covered in the FAQ in section 7. In this article, "stop hunting" refers to the practice and "a stop hunt" to a single instance of it.
2. Why Stop Hunts Happen: Stop Orders, Liquidity and Order Clustering
A stop hunt is the result of three things stacking up.
-
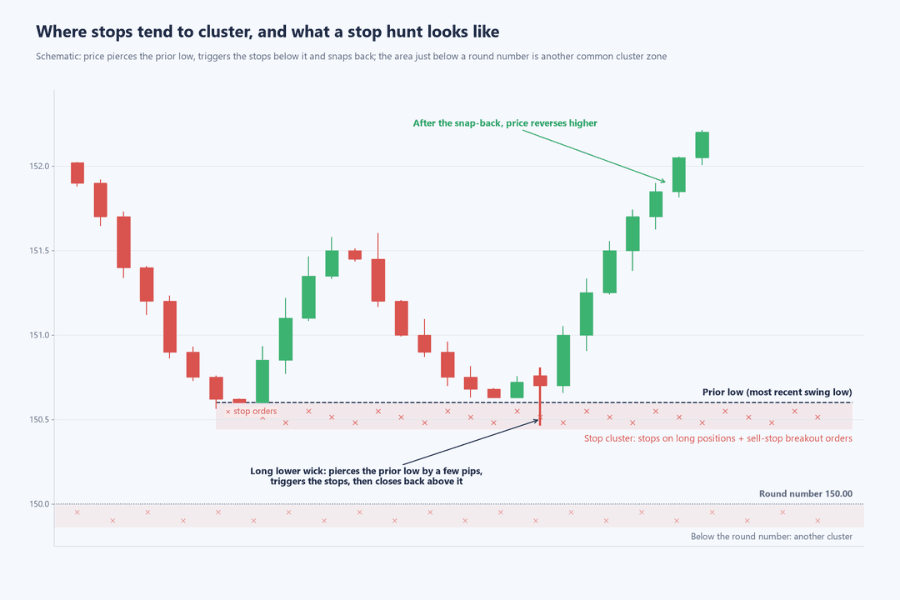
Orders cluster at similar prices: a few pips below the prior low, just under a round number, right beneath a support line. These spots are easy to see and easy to pick, so that is where stops go. Stops on long positions, sell-stop orders from traders waiting to short a breakdown, and other conditional orders end up piled around the same price.
-
A cluster firing at once amplifies short-term movement: a stop-loss is a type of pending order. It is only sent when price reaches the set level, and a standard stop then fills at the current market price (stop-limit orders work differently). When price breaks a prior low, the stops on long positions and the breakout sellers all hit the market together, selling pressure jumps for a short time, and price tends to accelerate.
-
Then one of two things happens: if fresh selling comes in below the level, price keeps falling and it is a genuine breakout. If the selling is exhausted within a few candles and buyers absorb it, price returns to the range, and that is what traders call a stop hunt. Triggered stops explain the acceleration; the reversal still needs buyers to step in.
Liquidity is the key word in this process. When a stop cluster fires, a batch of market orders hits the market at once. For a participant who needs to fill a large size, that is liquidity to trade against, which is why you often hear that "big players use these levels to get filled."
That claim cannot be proven from a chart. Even without anyone deliberately pushing price, the three things above are enough to produce the same move.
Many traders ask whether the broker is involved. The answer depends on the execution model. A dealing-desk market maker may take the other side of client trades. A no-dealing-desk STP/ECN broker passes orders to external liquidity providers and holds no position against the client.
Titan FX runs on the STP/ECN no-dealing-desk model, with orders routed to external liquidity providers. Under this setup, a stop gets swept because many traders in the market placed their stops at the same price.
| Mechanism | What happens | Result |
|---|---|---|
| Order clustering | Stops, breakout orders and conditional orders pile up at obvious prices | Unusually large order volume at that price |
| Cluster firing | Stops fill at market and hit in the same direction as breakout orders | Short-term acceleration |
| Snap-back or follow-through | Selling exhausted and buyers absorb it: snap-back; fresh selling arrives: follow-through | Stop hunt or genuine breakout |
| STP/ECN broker | Orders go to liquidity providers; no position against the client | Whether a stop is swept depends on the market's order distribution |
3. Where Do Stops Cluster? Five Places
If you know where stops are likely to cluster, you know where price is likely to whipsaw when it breaks through. Nobody can see the actual distribution of stops. The five places below are inferred from how most traders set their stops, and they are the most common ones in forex and CFD markets.
-
Just beyond prior highs and lows: below the most recent swing low and above the most recent swing high is the textbook place for a stop, and the place where the most stops gather. The more obvious the low and the more traders who see it, the denser the stops beneath it.
-
Round numbers: levels like 150.00 on USD/JPY, 1.1000 on EUR/USD or 3,000 on gold carry an unusual number of stops and pending orders, and price often pokes back and forth around them.
-
Just outside support and resistance lines: support and resistance lines are drawn in the same place by most traders. A few pips beyond the line is the standard spot for a stop and also the entry point for breakout orders. With both types of orders stacked together, the acceleration on a break is especially sharp.
-
The edges of a range: the top and bottom of a box or triangle consolidation hold the stops of positions inside the range on one side and breakout orders waiting outside on the other. Price often pierces one edge first and then travels to the opposite edge.
-
Widely watched technical levels: stops also gather around popular moving averages (the 20-, 50- and 200-day on the daily chart, for example) and the Bollinger Bands, but they are usually less concentrated than at the four places above.
These places share one trait: everyone can see them and everyone can calculate them. There is nothing wrong with a stop there, but you should know that it will be sitting alongside many other traders' stops.
| Place | Why stops gather there | What a sweep typically looks like |
|---|---|---|
| Beyond prior highs and lows | The textbook stop location | A few pips through the low, then back |
| Round numbers | Heavy in both stops and pending orders | Repeated pokes on either side of the level |
| Outside support and resistance | Stops and breakout orders stacked together | False breakout, then back into the range |
| Range edges | Stops of in-range positions concentrate | One edge swept first, then a move to the other |
| Widely watched technical levels | Many traders reference them | Dip through the moving average, then a quick recovery |
4. How to Recognize a Stop Hunt: Three Signs and a USD/JPY Example
A stop hunt can only be confirmed after the fact, but three signs raise your confidence in real time.
-
A long wick: price pushes a little way through a key level, and the candle closes back on the original side, leaving a long lower or upper wick. The longer the wick and the closer the body closes to the inside of the level, the more it looks like a sweep.
-
A limited break and a fast reclaim: price does not keep extending beyond the level; it returns to the range within a few candles. Judge the size of the break against the instrument's current volatility, using ATR or the recent average range as a yardstick. Ten pips on USD/JPY and ten dollars on gold are not the same scale.
-
What follows the reclaim: after the reclaim, price usually heads the other way and sometimes breaks straight through the opposite side of the range. The faster the reversal, the clearer it is that no fresh orders were waiting beyond the level. If price breaks down again right after the reclaim, the stop-hunt reading no longer holds.
Take USD/JPY daily candles from the Titan FX exchange rate history database. The chart below shows June to July 2025.
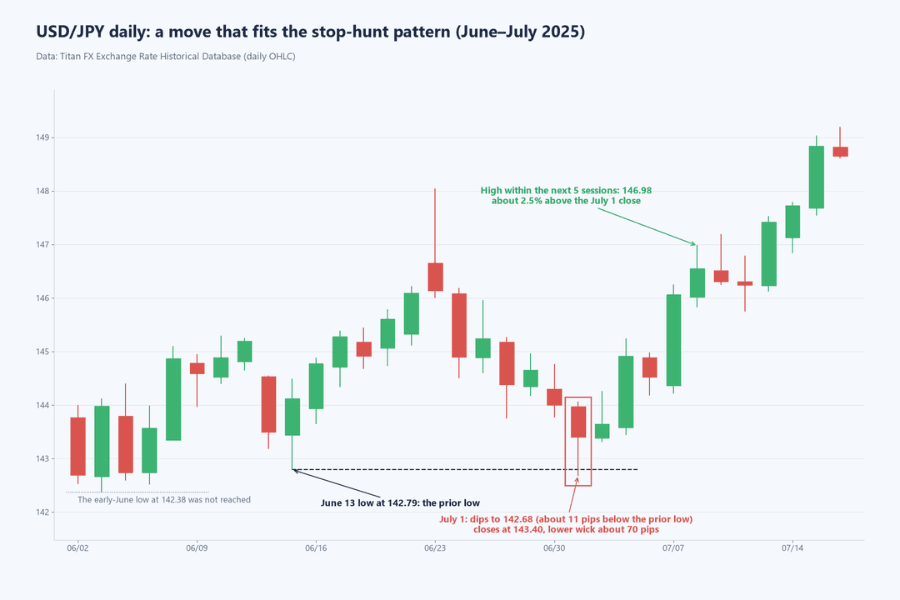
The June 13 low at 142.79 was a clear swing low, and price held above it for the next two weeks. On July 1, price dipped to 142.68, about 11 pips below the prior low, and closed at 143.40, leaving a lower wick of about 70 pips. The early-June low at 142.38, further down, was never reached.
Just below the prior low is exactly where stops cluster most, and this candle swept through it and came back. Over the next five sessions, price reached a high of 146.98, about 2.5% above the July 1 close.
Judged by the price pattern, this is a case that fits the classic signs of a stop hunt: a long lower wick, a limited break, and no follow-through the next day. Daily OHLC data cannot show how many stops were actually triggered, so the judgment rests on the pattern alone.
These three signs describe the shape of the move. A similar long wick can also come from the burst of volatility right after a news release, or from a price jump during a thin-liquidity session. Check the time of the move and whether any data was released.
| Sign | Looks like a stop hunt | Looks more like a genuine breakout |
|---|---|---|
| Wick | Long wick, close back inside the level | Body closes beyond the level |
| Size of the break | Small relative to current volatility | Keeps extending |
| What follows | Reversal within a few candles | Consolidates beyond the level, then continues |
5. Where to Place a Stop So It Survives: Three Methods and a Tool
A stop is not optional; the question is where to put it. The order to follow is: first find the price where the trade idea fails, then size up the normal volatility and add a buffer, and finally set the lot size from the stop distance. The three methods below work together.
-
Add a buffer beyond the failure point: a stop is based on where the trade logic breaks. If you are long, a break of the prior low is the failure point. Place the stop some distance beyond it so that ordinary noise cannot reach it. ATR is the most objective way to size the buffer. A commonly tested value is 0.5 to 1 times the 14-day ATR; the actual multiple should come from testing on your instrument and timeframe.
-
Avoid round numbers and the most obvious prices: do not let the stop price itself sit on a round number or on the line everyone has drawn. Nudge it outward to a less tidy price. A stop does not need to be a neat number.
-
Match the lot size to the stop distance: a bigger buffer means a longer stop distance, and keeping the dollar risk per trade constant means trading fewer lots. The position sizing formula starts with how much you are willing to lose on the trade and works back to the lot size from the stop distance. Get the order right: risk amount and stop distance first, lot size last.
The buffer's job is to keep normal volatility from taking you out early while preserving a clear failure point. A wider stop is not automatically safer: the longer the distance, the fewer lots the same risk amount can buy, and the risk-reward ratio changes with it.
For how to set stop distances across instruments and timeframes, see our comparison of five stop-loss methods. The buffer method in this article combines the structure-based and ATR-based stops from that comparison.
| Method | How | Cost |
|---|---|---|
| Buffer beyond the failure point | Add an ATR-sized buffer beyond the prior low or support | Longer stop distance |
| Avoid obvious prices | Keep the stop off round numbers and commonly drawn lines | An untidy stop price |
| Match lots to distance | Keep the risk amount fixed; trade fewer lots as the distance grows | Smaller profit per trade as well |
Using a tool to see where orders cluster
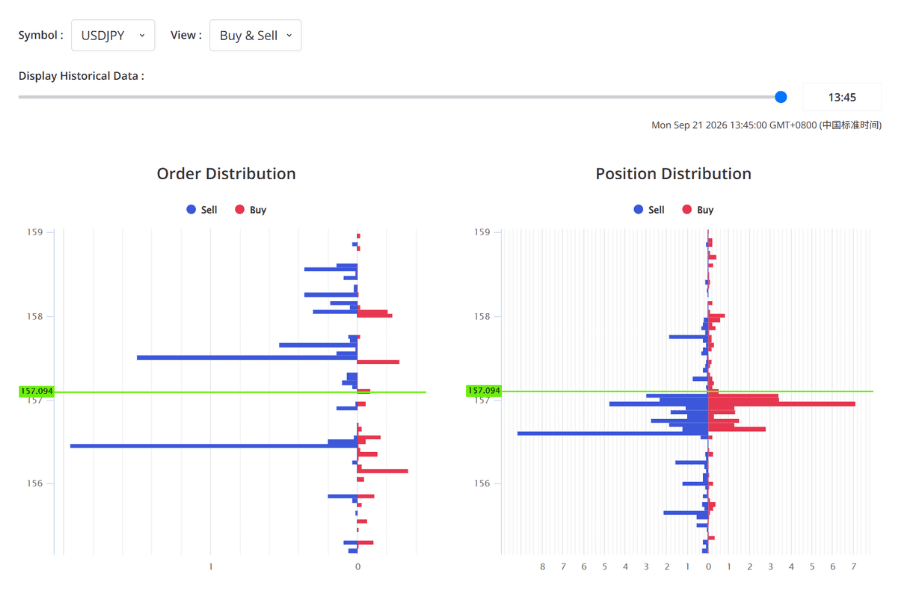
Titan FX's Pending Orders and Open Position Trends plots client pending orders and open positions by price level for three instruments: USDJPY, EURUSD and XAUUSD.
What it can answer is "which price levels have the most orders." The chart cannot separate stop orders from limit orders, and its scope is limited to Titan FX clients, so it does not represent the whole market.
The way to use it is cross-checking. Note the levels where the bars pile up highest, then compare them with the prior highs and lows, round numbers and support and resistance lines on your chart.
Where several pieces of information point to the same area, put that price on your watch list: keep your stop away from it, or place the stop beyond it with a buffer. A tall bar does not mean price is bound to go there.
6. Turning It Around: How to Enter After a Sweep
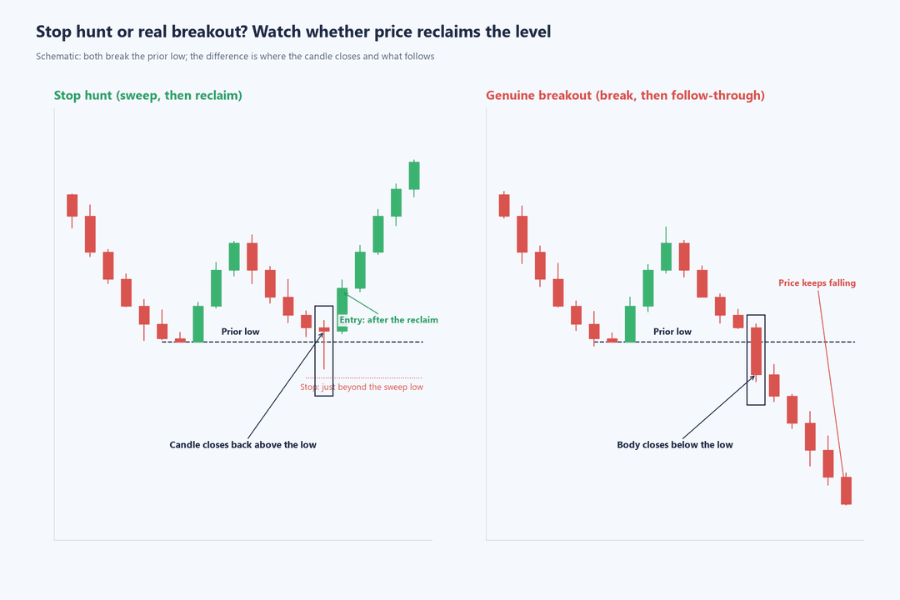
Because order clusters are where price tends to whipsaw on a break, the snap-back after a sweep can serve as one of your conditions for spotting a reversal. The method is the same as trading a false breakout; the only difference is that you focus on the prices where stops are likely to cluster. The single most important question is whether price reclaimed the level after breaking it.
-
Wait for the reclaim before entering: after price pierces the prior low, wait for a candle to close back above it before you enter. There is no basis for picking the bottom at the tip of the wick. The reclaim is the minimum condition for calling it a sweep; without it, it is just a breakdown.
-
Put the stop beyond the extreme of the sweep: the low of the sweep is now the newest stop cluster. Place your stop beyond it with a buffer. If price breaks that low again, the stop-hunt reading is no longer valid.
-
Aim for the other side of the range: after a sweep, price often travels to the opposite side of the consolidation. The prior high, the top of the range or the next stop cluster are the usual targets. Calculate the risk-reward ratio before entering, and skip the trade if the distance between target and stop does not meet your strategy's rules.
-
Add one more confirmation: whether the next candle after the long wick continues the reversal, whether RSI shows a divergence, and whether the sweep occurred near support on a higher timeframe all help reduce false calls.
The most common failure of this method is a sweep that does not reverse: price reclaims the level for one candle, then breaks down again the next day and turns into a genuine breakout. The stop beyond the extreme exists precisely for that case, and the cost of one failure stays under control.
| Step | What to do |
|---|---|
| Watch | Price pierces the stop cluster beyond a prior low or support |
| Entry condition | A candle closes back on the original side of the level |
| Stop | Beyond the low (or high) of the sweep, plus a buffer |
| Target | The other side of the range, or the next stop cluster |
| Invalidation | Price breaks through the extreme of the sweep again |
7. Frequently Asked Questions About Stop Hunting
Q1: Do brokers hunt my stops?
It depends on the execution model. A dealing-desk market maker may internalize client orders and take the other side of the trade. An STP/ECN no-dealing-desk broker passes orders to external liquidity providers and holds no position against the client. Under the STP/ECN model, a swept stop reflects the distribution of orders in the market.
Q2: What is the difference between a stop hunt and a false breakout?
They usually refer to the same move, viewed from different angles. A false breakout describes it in terms of chart patterns: the breakout failed. A stop hunt describes it in terms of orders: the breakout triggered stops and then reversed.
You can identify a false breakout from the candles, but you cannot see how many stops were actually triggered. The way to recognize and trade both is essentially the same: wait for the reclaim and put the stop beyond the extreme.
Q3: If I trade without a stop, can I avoid being hunted?
Trading without a stop only swaps a defined small loss for an undefined large one. If price does not reverse after the sweep, a position with no stop keeps bleeding.
The right fix is to place the stop beyond a buffer and trade fewer lots. A mental stop rarely gets executed in a fast market, and slippage will be worse than on a stop order placed in advance.
Q4: When are stop hunts most likely?
When volatility jumps suddenly, such as in thin-liquidity sessions, around major data releases, or just before and after major markets open, price can punch through key levels more easily. Timing alone cannot tell you whether a move was a stop hunt, and no instrument can be said to see them more often as a rule.
What you can do is know in advance when volatility tends to rise. The volatility heatmap shows how each session moves, and the times of major data releases should be checked beforehand.
Q5: Can stop hunts be predicted?
The location, yes; the timing, no. The prices where stops are likely to cluster can be inferred from prior highs and lows, round numbers and the order distribution on your chart. When price will go after them, and whether it will reverse afterward, cannot be known in advance.
In practice, these prices become part of your plan: keep your stop away from them, and wait for them to be swept before you enter.
8. Summary
A stop hunt is a move through a stop cluster that triggers the stops and then snaps back, also known as a liquidity sweep. The mechanism is simple: orders pile up at obvious prices, and a cluster firing at once amplifies short-term movement. If price then keeps going, it is a genuine breakout; if it comes back, it is a stop hunt.
The candles show only what price did, never who triggered how many stops.
On defense, start the stop at the price where your trade idea fails, add an ATR-based buffer, stay off round numbers, and match the lot size to the distance. On offense, consider an entry only after price has swept the cluster and reclaimed the level, with the stop beyond the extreme of the sweep.
Pending Orders and Open Position Trends shows where Titan FX client orders cluster. Cross-checked against the chart structure, it gives both your stop placement and your entry decision a solid basis.
Further Reading
- Range Trading: Strategy, Indicators, and Risk Management
- What Is Market Sentiment? How It Drives Forex and CFD Markets
- Limit Order: Definition, Benefits, and How to Use It
- Can You Lose Money in Forex? Beginner's Guide to Risks and Defense
- Forex Trading Strategy: A Complete Guide for Beginners to Build and Execute
Titan FX Trading Strategy Lab. We produce investor-education content covering forex, commodities (crude oil, precious metals, agricultural goods), stock indices, US equities, and digital assets.
Primary Sources (by Category)
- Market structure and orders: MetaQuotes MT4/MT5 documentation — how stop and pending orders are triggered and executed; Titan FX Research — Pending Orders and Open Position Trends, and the guide to forex execution models (DD/NDD/STP/ECN)
- Price data: Titan FX Research exchange rate history database — USD/JPY daily OHLC for June to July 2025 (source of the example chart in section 4)