
 Home
Home- Investment Guide: Strategies for Stocks, Forex, and Metals
- Position Sizing: Lot Size, Pip Value and Margin Calculator
Position Sizing: How to Calculate Forex Lot Size, Pip Value and Use the Margin Calculator
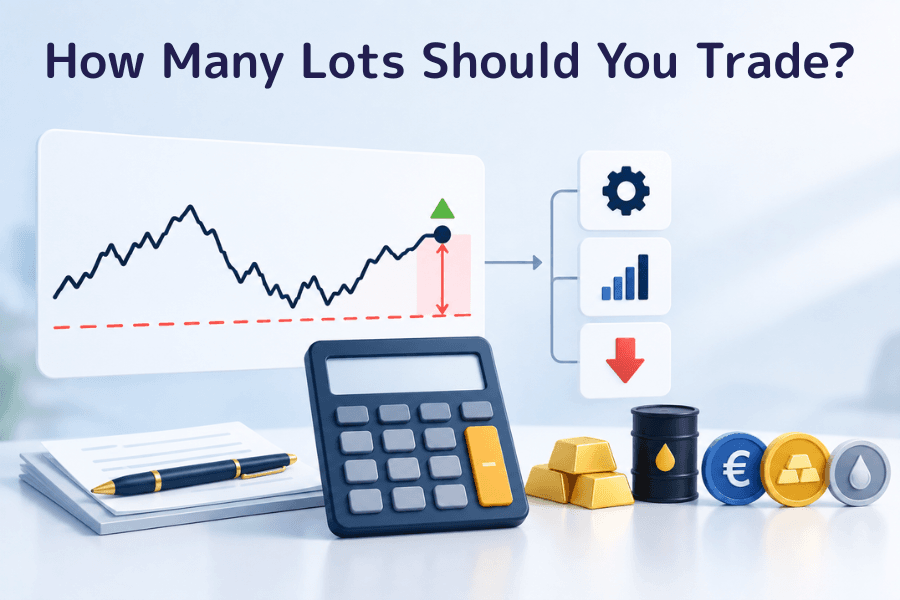
Position sizing is the process of deciding how many lots to trade on each position, based on your account balance, the loss you can accept on a single trade, and the distance to your stop-loss. With the same entry and the same stop, 0.1 lots and 1 lot produce results ten times apart; the lot size decides how much you lose when the trade is wrong.
Most people's first question before placing an order is whether they have enough margin. Position sizing answers a different question: how much the account will shrink if the stop is hit. In leveraged products such as forex and CFDs the gap between the two is wide. One lot of EUR/USD needs only a few hundred dollars of margin, yet a 50-pip stop costs about $500.
The division of labor with our article on the 2% rule is simple: the 2% rule answers "how much am I willing to lose on this trade," and position sizing answers "so how many lots should I trade." This article covers the three inputs and four steps of the lot size formula, how to calculate pip value for forex, gold, indices, crude oil and crypto, how to reverse-engineer lot size with the Titan FX margin calculator, three ways to set the stop distance, and how to manage total risk across several positions, plus the common mistakes.
- Lots = risk per trade ÷ (stop distance × profit or loss per unit of price movement); the three inputs come from your account and risk percentage, your stop placement, and the instrument's contract size
- Margin and risk amount are two different things: with the same lots and prices, moving leverage from 100:1 to 500:1 cuts the margin on 0.25 lots of EUR/USD from $275 to $55, while the loss on a 40-pip stop is $100 either way
- "One point" is not a unit shared by every instrument: P/L per lot is price change × contract size and differs by instrument and quote currency, for example $10 per pip on a standard lot of EUR/USD and $100 per $1 on XAU/USD, with a conversion when the quote currency is not your account currency
- Micro accounts shrink contract sizes by different ratios: forex is 1/100 of a standard account, while gold, silver and BTC/USD are 1/10, so you cannot simply divide everything by 100
- The Titan FX margin calculator accepts a stop-loss price directly, so you can read the "Estimated Loss" against your risk budget and adjust the lots; the formula estimates price risk only, and slippage, gaps and trading costs are extra
- 1. What Is Position Sizing? How It Differs from Risk Percentage and Margin
- 2. How to Calculate Forex Lot Size: The Position Sizing Formula in 4 Steps
- 3. How to Calculate Pip Value: Contract Size and P/L per Lot by Instrument
- 4. Don't Want to Do the Math? Reverse-Engineer Lot Size with the Margin Calculator
- 5. How to Set the Stop Distance: Fixed Pips, Technical Levels and ATR
- 6. Managing Several Positions: Total Risk, Correlation and Common Mistakes
- 7. Position Sizing FAQ
- 8. Summary
1. What Is Position Sizing? How It Differs from Risk Percentage and Margin
Position sizing sets the size of each position, which in forex and CFDs means the number of lots. It rests on three things:
-
How much is in the account and how much you are willing to lose on this trade: together they make the "risk amount"
-
Where the stop-loss goes: the distance from entry to stop is the "stop distance"
-
The instrument's contract size: it decides how much you lose per unit of price movement
Put the three together and the lot size is the result.
The 2% rule answers the "how much am I willing to lose" part: no single loss larger than 2% of the account, and some traders use 1%. It is one input to position sizing, not the whole of it. At the same 1%, a 20-pip stop and an 80-pip stop give lot sizes four times apart, and that is the part position sizing handles.
Margin is a separate matter. It is the collateral frozen when a position is opened and released when it is closed, and its amount depends on lots, price and leverage. What you lose when the stop is hit depends on lots and stop distance, and leverage does not enter that calculation.
The clearest way to see it is the same order at two leverage settings. For 0.25 lots of EUR/USD with a 40-pip stop:
-
100:1 leverage: margin $275, loss at the stop $100
-
500:1 leverage: margin $55, loss at the stop $100
Leverage changes how much is frozen, not how much the order can lose. The risk of high leverage is that it lets you open a much larger position, so what you actually need to control is still the lot size and your total exposure.
| Item | Determined by | Question it answers |
|---|---|---|
| Risk amount | Account balance × risk percentage | How much can this trade lose at most |
| Stop distance | Technical level, ATR or a fixed number of pips | Where do I admit I was wrong |
| P/L per unit of price movement | The instrument's contract size and your account currency | How much do I lose per unit the price moves |
| Lots | Risk amount ÷ (stop distance × P/L per unit) | How big should the trade be |
| Margin | Lots × contract size × price ÷ leverage | How much is frozen when I open it |
2. How to Calculate Forex Lot Size: The Position Sizing Formula in 4 Steps
Position sizing has one formula:
Lots = risk per trade ÷ (stop distance × P/L per unit of price movement)
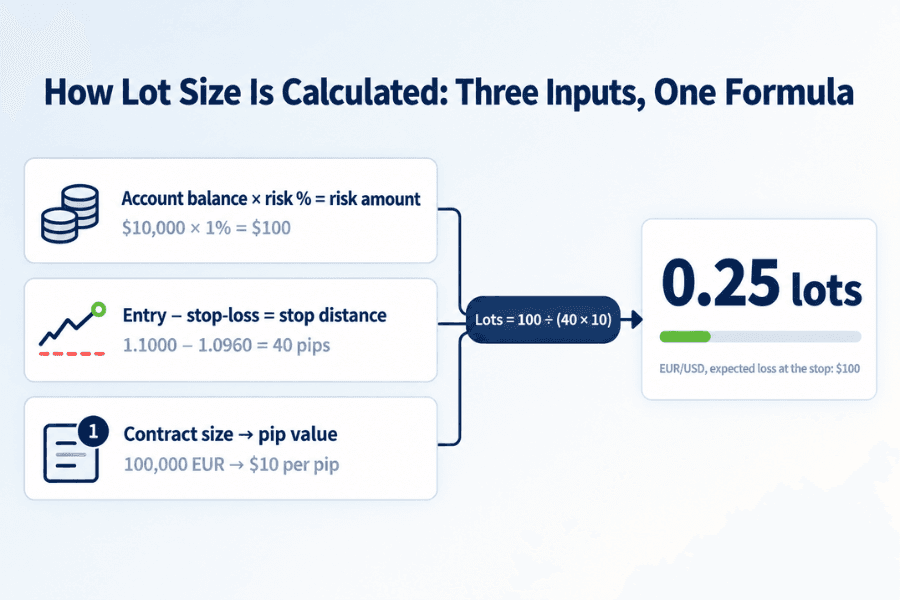
In forex the unit of price movement is the pip, so "P/L per unit" is simply the pip value of one lot; other instruments are covered in Section 3. The calculation takes four steps. The example below uses a $10,000 USD account, 1% risk, and EUR/USD on a Standard account.
1. Work out the risk amount
$10,000 × 1% = $100. This is the largest loss you accept if the stop is hit, and it is decided before any view on the market.
2. Set the stop distance
Use technical analysis to fix the entry and the stop-loss. Say you buy EUR/USD at 1.1000 with the stop below the recent low at 1.0960: a distance of 40 pips.
3. Look up the pip value
On Standard and Blade accounts one standard lot is 100,000 euros, and a 1-pip move (0.0001) in EUR/USD is worth $10. That figure applies to every pair quoted in US dollars on those two account types; Micro accounts use different contract sizes, covered in Section 3.
4. Put it into the formula
$100 ÷ (40 pips × $10) = 0.25 lots. With 0.25 lots, the price loss is $100 if the stop fills at the set price. The trade amount is $27,500 (0.25 × 100,000 × 1.1000), and the margin at 500:1 leverage is $55.
Round the result down to the smallest step the platform allows. On a Titan FX Standard account, forex starts at 0.01 lots in steps of 0.01; stock indices and crude oil start at 0.1 lots in steps of 0.1. A result of 0.256 becomes 0.25 lots and 0.66 becomes 0.6. Trade a little less rather than stretching the risk past the budget.
The formula estimates price risk only
The formula counts only the price risk from entry to stop, and it assumes the stop fills at or near the set price. Around major events, in thin liquidity, over a weekend gap or in a fast market, slippage can make the actual loss larger than the calculated one. Spreads, commissions and swap points are further trading costs, and their share of the risk budget deserves attention when the stop is tight or the holding period is long. Every "loss of $100" in the rest of this article is an estimate in this sense.
3. How to Calculate Pip Value: Contract Size and P/L per Lot by Instrument
Start with a concrete question: if you trade one lot and the price moves a little, how much do you make or lose? The answer depends on just two things: what one lot represents, and how far the price moved.
P/L on one lot = price change × contract size
"Contract size" is the quantity one lot represents: one lot of EUR/USD is 100,000 euros, one lot of gold is 100 troy ounces, one lot of US30 is one index contract. The unit of price change depends on how the instrument is quoted: forex is conventionally measured in pips (1 pip = 0.0001 for most pairs and 0.01 for yen pairs), gold, crude oil and crypto in dollars, and stock indices in index points.
Multiply the two and you have the P/L on one lot. For gold: a $1 move × 100 ounces = $100 per lot. The table lists the figures for the common instruments on a Titan FX Standard account, with the calculation in parentheses in the last column.
| Instrument | One lot represents | One unit of price movement | P/L on one lot |
|---|---|---|---|
| EUR/USD | 100,000 EUR | 1 pip = 0.0001 | $10 (0.0001 × 100,000) |
| USD/JPY | 100,000 USD | 1 pip = 0.01 | 1,000 JPY (0.01 × 100,000) |
| XAU/USD | 100 oz | $1 | $100 (1 × 100) |
| XAG/USD | 5,000 oz | $0.01 | $50 (0.01 × 5,000) |
| US30, NAS100, US500 | 1 index contract | 1 point | $1 (1 × 1) |
| JPN225 | 100 index contracts | 1 point | 100 JPY (1 × 100) |
| XTI/USD (WTI crude) | 100 barrels | $1 | $100 (1 × 100) |
| BTC/USD | 1 BTC | $1 | $1 (1 × 1) |
P/L is calculated in the quote currency. USD/JPY and JPN225 come out in yen, so a US dollar account has to divide by the USD/JPY rate of the moment: at 156, 1,000 yen is about $6.40 and 100 yen about $0.64. This is the step most often missed in hand calculations, and Section 4 hands it to the tool.
Back into the lot size formula
Once you have the P/L on one lot, the denominator of the formula is that figure times the stop distance. With the same $100 risk budget, the lot sizes differ widely across instruments:
| Instrument | Stop distance | Loss on one lot | Lots |
|---|---|---|---|
| XAU/USD | $8 | $800 (8 × 100) | 100 ÷ 800 = 0.125, trade 0.12 lots |
| US30 | 150 points | $150 (150 × 1) | 100 ÷ 150 = 0.66, trade 0.6 lots |
| JPN225 | 300 points | 30,000 JPY (300 × 100), about $192 | 100 ÷ 192 = 0.52, trade 0.5 lots |
| WTI crude | $1.20 | $120 (1.2 × 100) | 100 ÷ 120 = 0.83, trade 0.8 lots |
| BTC/USD | $1,500 | $1,500 (1,500 × 1) | 100 ÷ 1,500 = 0.066, trade 0.06 lots |
Micro accounts: one lot represents a different quantity
Micro accounts use smaller contract sizes, but the reduction differs by instrument: forex lots are 1/100 of a Standard account, while gold, silver and BTC/USD are 1/10, so the P/L per lot shrinks by the same ratios and the table above cannot simply be divided by 100. The instruments available on a Micro account are mainly thirty-odd currency pairs plus gold, silver and BTC/USD, with no stock indices or crude oil. This is the specification behind starting forex with a small account.
| Instrument | Standard or Blade account, one lot | Micro account, one lot |
|---|---|---|
| Forex | 100,000 units | 1,000 units |
| XAU/USD | 100 oz | 10 oz |
| XAG/USD | 5,000 oz | 500 oz |
| BTC/USD | 1 BTC | 0.1 BTC |
4. Don't Want to Do the Math? Reverse-Engineer Lot Size with the Margin Calculator
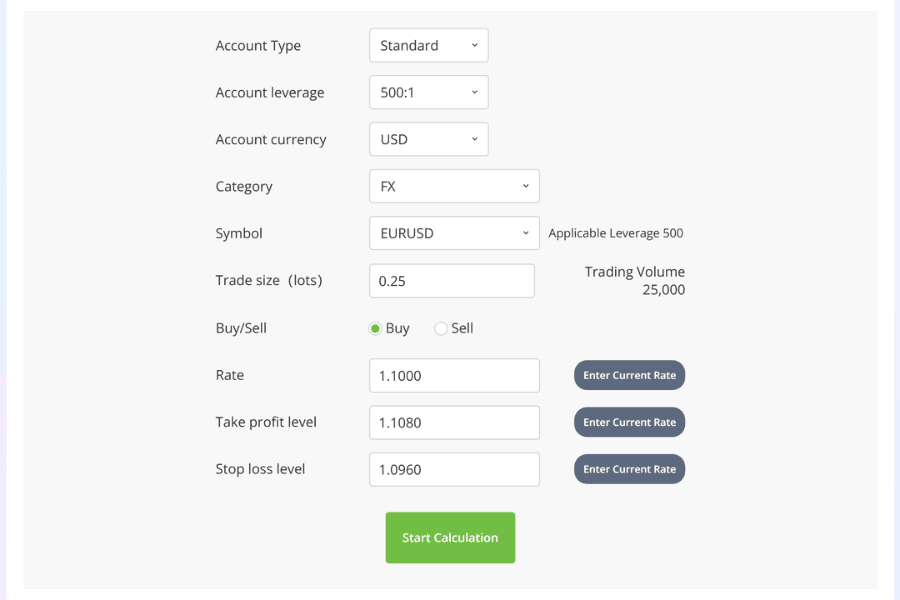
The yen conversion and the account currency handling from the last section are done automatically by the Titan FX margin calculator. Besides margin, it accepts a stop-loss and a take-profit price and returns the estimated loss and the P/L per pip for the order, so it can be used in reverse: enter the stop first, then adjust the lots until the estimated loss equals your risk budget.
1. Set the account conditions
Choose the account type (Standard, Blade or Micro), the account leverage and the account currency (JPY, USD, EUR or SGD). They must match your real account, because these three settings determine the contract size, the margin and the conversion currency.
2. Enter the symbol, lots and price
Choose the category and symbol, then enter the trade size in lots and the rate. The "Enter Current Rate" button next to the price field fills in the live quote. For lots, start with the provisional figure from the formula, for example 0.25.
3. Enter the stop price and read "Estimated Loss"
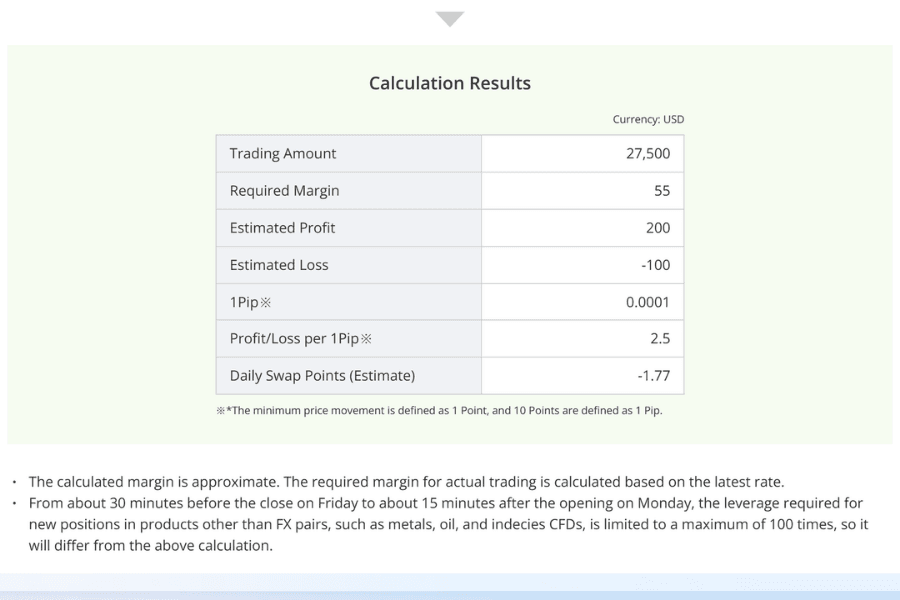
Type the stop price into "Stop loss level" and press Start Calculation. In the results, "Estimated Loss" is the loss if the stop fills at that price, and "Profit/Loss per 1Pip" is the pip value at that lot size. For 0.25 lots of EUR/USD entered at 1.1000 with the stop at 1.0960, the result is an estimated loss of −$100, $2.50 per pip and a required margin of $55.
4. Adjust the lots until the estimated loss equals the budget
If the estimated loss is above the budget, reduce the lots; if it is below, you can add. Recalculate after every change, and come back to this step whenever the stop distance changes. Glance at "Daily Swap Points (Estimate)" as well, and add that cost in for positions you plan to hold for several days. A note under the results says that from about 30 minutes before Friday's close to about 15 minutes after Monday's open, the leverage on new positions in metals, crude oil and index CFDs is capped at 100:1. A new position opened over the weekend needs more margin than the weekday figure; the risk amount does not change.
| Method | Use |
|---|---|
| The formula by hand | Understand where the lot size comes from and which input changes when you switch instruments |
| Margin calculator | Confirm lots, estimated P/L and required margin before placing the order, without manual currency conversion |
| MT4 and MT5 specification window | Final check of the actual contract size and minimum lot for the instrument |
5. How to Set the Stop Distance: Fixed Pips, Technical Levels and ATR
The stop distance is the only input in the formula that the trader decides subjectively, and it drives the lot size directly. There are three common ways to set it:
-
Fixed pips: the same distance on every trade, for example always 30 pips on EUR/USD. It is the simplest to calculate, but it ignores the market: too wide in a range, too tight in a trend. It suits beginners who first want to get the routine right.
-
Technical levels: place the stop just beyond support or resistance, a recent high or low, or the edge of a chart pattern, so that being stopped out means the reason for the entry no longer holds. The distance changes with the chart and so does the lot size; this is what most discretionary traders do. The methods are compared in How to Set a Stop Loss.
-
ATR: use a multiple of the Average True Range (ATR), for example 1.5× or 2× ATR, as the distance. When volatility is high the stop widens and the lot size shrinks automatically, and the reverse when it is low. If you use the daily ATR, check the instrument's volatility in your own trading hours on the Volatility Heatmap first.
Whichever method you use, the order is the same: set the stop first, then calculate the lots. If you decide the lots first and then look for a stop, the stop gets dragged by the lot size to places it should not be. When the stop distance changes, the lot size changes in inverse proportion: with the same $100 budget, a 40-pip stop on EUR/USD gives 0.25 lots, while widening it to 80 pips allows only 0.12 lots, and the estimated loss stays around $100.
6. Managing Several Positions: Total Risk, Correlation and Common Mistakes
Once a single trade is sized correctly, there are three further layers of adjustment and three common mistakes.
Total risk when holding several positions at once
Five open positions at 1% each add up to a nominal risk of 5%, the sum of the stop amounts. The actual portfolio risk also depends on the correlation between the positions and on when each stop is triggered, so it is not exactly 5%. Highly correlated positions in particular have to be looked at together. Going long EUR/USD and GBP/USD at the same time means both positions carry short exposure to the US dollar; if the two are strongly correlated at the time, a broad dollar rally can trigger both stops at once, so they cannot be treated as two unrelated 1% risks. Before opening a new position, check the correlation coefficient between it and your existing instruments on the Correlation Matrix, and set a cap on total risk across all open positions, with the number chosen for your strategy, trading frequency and drawdown tolerance. Without a cap, every trade can be within the rule and yet seven or eight positions in the same direction can leave the account exposed to a single large move, and in the worst case to a loss cut.
Choosing the risk percentage
1% or 2% are only common starting points; the right figure depends on the strategy's win rate and risk-reward ratio. For the same win rate and payoff, 2% and 5% give very different probabilities of ruin, so run your own figures through the risk of ruin simulator before deciding. The fraction given by the Kelly criterion assumes the win rate and payoff are estimated accurately, which is why some traders scale it down to half Kelly or quarter Kelly to limit estimation error and drawdowns.
Adjusting after a losing streak
When equity falls, calculate the risk amount from current equity rather than the starting balance; the lot size then shrinks with the account automatically, which is the protection built into fixed-fractional sizing. Some traders halve the percentage again once the drawdown reaches a set level and keep it there until equity returns to its high. The opposite approach, increasing size after losses to win it all back at once, is Martingale-style averaging, and the risk grows geometrically.
Common mistakes
-
Sizing by whether the margin is enough: free margin only tells you whether the position can be opened, not what it loses at the stop. With high leverage the margin is small, and it is easy to open a position far beyond the risk budget.
-
Ignoring the account currency: on a JPY account, a EUR/USD loss is calculated in yen. For the same 0.25 lots and 40-pip stop, the calculator shows an estimated loss of roughly 15,600 yen, and the risk budget has to be set in yen as well.
-
Not reducing size before major events: around high-impact events on the Economic Calendar such as central bank decisions and the jobs report, spreads and gaps widen and stops can fill at worse prices than expected. Cutting the lot size beforehand is the most direct defense.
7. Position Sizing FAQ
Q1: What is the difference between risking 1% and 2% per trade?
The difference is how fast the account shrinks in a losing streak. After ten straight losses, a 1% account keeps about 90% and a 2% account about 82%; getting back to the starting point takes a return of about 11% in the first case and 22% in the second. A lower percentage leaves more room to test a strategy, at the cost of slower gains. The usual approach is to start with the lower figure, build a record of enough representative trades, confirm the strategy has a positive expectancy, and then reassess.
Q2: What is the difference between margin and the risk amount?
Margin is the collateral frozen when a position is opened; it changes with leverage and is released when the position is closed. The risk amount is what you lose when the stop fills, and it depends only on lots and stop distance. On the same 0.25 lots of EUR/USD, moving leverage from 100:1 to 500:1 lowers the margin from $275 to $55, while the estimated loss on a 40-pip stop is $100 in both cases.
Q3: What if the calculated lot size is below the minimum lot?
It means the stop distance is too wide for the risk budget, or the account is too small. If the stop set by your trading logic cannot be tightened, do not move it closer just to reach the platform's minimum lot; skip the trade, or use the smaller contract size of a Micro account if it supports the instrument. Raising the risk percentage to make the lots fit is the option to avoid.
Q4: Why do USD/JPY and EUR/USD give different lot sizes for the same 40-pip stop?
Because the pip values differ. One lot of EUR/USD is worth $10 per pip, while one lot of USD/JPY is worth 1,000 yen per pip, about $6.40 at a USD/JPY rate of 156. With the same $100 budget and 40-pip stop, EUR/USD gives 0.25 lots and USD/JPY about 0.39 lots. The pip value of yen-quoted instruments moves with the exchange rate, and the calculator saves you that conversion.
Q5: Can the margin calculator work out take-profit as well?
Yes. Enter a take-profit level and the results show the estimated profit, which together with the estimated loss gives the trade's risk-reward ratio. A EUR/USD trade with an 80-pip take-profit and a 40-pip stop shows an estimated profit of $200 against an estimated loss of $100, a ratio of 2.
8. Summary
Position sizing turns "how much do I lose if this trade is wrong" into a procedure: decide the risk first, then calculate the lots. The risk amount comes from the account and the risk percentage, the stop distance from technical levels or ATR, and the P/L per unit of price movement from the instrument's contract size; put the three into the formula and you have the lot size. Margin is a separate matter that moves with leverage, while the loss at the stop does not, and the formula estimates price risk only, with slippage, gaps and trading costs to be counted separately.
In practice, entering the stop price in the Titan FX margin calculator, reading the estimated loss and adjusting the lots is less error-prone than hand calculation for yen-quoted instruments, Micro accounts and account currencies. Once single trades are sized correctly, look at correlated positions together, cap total risk and cut size before major events, and position sizing grows from a formula into a money management habit.
Further Reading
- Why Forex Beginners Fail: 10 Mistakes & 7 Risk Strategies
- Forex Trading Basics: Pips, Pip Value, and Spread Explained
- What Is Currency Correlation? Patterns, Risk & Titan FX Tools
- Margin Call
- FX/CFD Equity Projection Simulator
Titan FX Trading Strategy Lab. We produce investor-education content covering forex, commodities (crude oil, precious metals, agricultural goods), stock indices, US equities, and digital assets.
Primary Sources (by Category)
- Tool specifications and measurements: Titan FX Research margin calculator — the account type, leverage, account currency and symbol options; the trading amount, required margin, estimated P/L and P/L per pip calculated for EUR/USD, USD/JPY, XAU/USD, XAG/USD, US30, NAS100, JPN225, XTI/USD and BTC/USD on a USD account at 500:1 leverage; and the note below the results on the weekend leverage cap
- Account specifications: Titan FX Standard, Blade and Micro account contract sizes, available instruments, minimum lots and lot steps (margin calculator symbol settings)
- Risk management concepts: general literature on fixed-fractional sizing, ATR-based stops and the Kelly criterion; Titan FX Research articles on the 2% rule, the risk of ruin simulator and the correlation matrix