

What Is Price Action Trading? Market Structure, Key Levels, Signals and a Trade Example
Trading this way with most indicators removed from the chart is often called naked trading. Most indicators are calculated from historical prices, while price action reads price itself. The tradeoff is that judgment is more subjective, so you need clear rules and practice.
This guide covers the three building blocks of price action (market structure, key levels, and candlestick signals), walks through a trade example from analysis to exit, and sums up the pros, cons, and common questions.
- Price action follows a sequence: market structure sets the direction, key levels decide where to trade, and candlestick signals decide when to enter
- Rising highs and lows form an uptrend; falling highs and lows form a downtrend. A close beyond an important swing high or low may mean the structure is changing
- Common signals include pin bars, engulfing candles, inside bars, and false breakouts. They carry more weight at key levels
- Place the stop beyond the signal candle or the swing high or low, and check the risk-reward ratio before entering
- Because judgment is subjective, set your rules in advance and practice on historical charts or a demo account
1. What Is Price Action Trading?
Every candlestick records the outcome of the contest between buyers and sellers over a period of time. Price action uses those candles and the pattern of highs and lows to judge which side is stronger and where the market may go next.
Here is how it compares with indicator-based trading:
| Aspect | Price action | Indicator-based trading |
|---|---|---|
| Basis for decisions | Candlesticks, highs and lows, support and resistance | Values calculated from price or other market data |
| Chart | Clean, with few or no indicators | One or more indicators, depending on the strategy |
| Signal source | Price movement itself | Signals from calculated indicators |
| Rules | More subjective; two traders may read a chart differently | Clear values make rules easier to standardize |
You don't have to choose one or the other. Many traders focus on price action and add a single moving average to help confirm the trend.
2. Market Structure: Start With the Direction
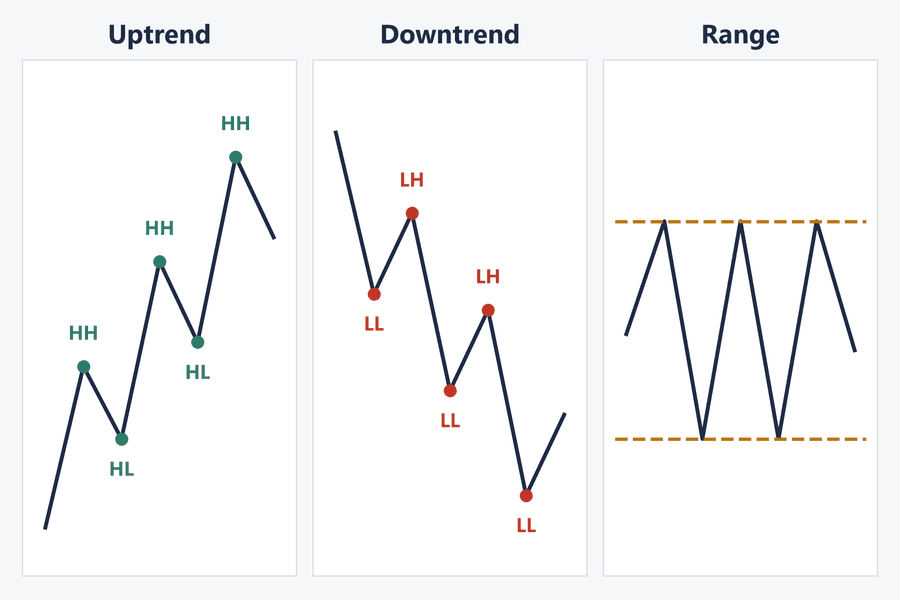
Market structure is the pattern formed by highs and lows, an idea that comes from Dow Theory. There are three basic types:
-
Uptrend: higher highs (HH) and higher lows (HL). The with-trend approach is to look for long entries on pullbacks
-
Downtrend: lower highs (LH) and lower lows (LL). The with-trend approach is to look for short entries on rallies
-
Range: highs and lows stay at about the same levels. You can trade against the edges of the range or wait for a breakout
The moment to watch most closely is a change in structure. In an uptrend, a close below the most recent clear pullback low (the swing low) breaks the pattern of highs and lows, and the uptrend may be ending. If price only dips below it during the session and quickly recovers, you can't draw that conclusion yet. In a downtrend, watch for a close above the swing high instead.
To practice reading structure, you can use the Titan FX MT4/MT5 indicator Titan_StructureMapper. It marks swing highs and lows automatically and shows two structure signals:
-
BOS (Break of Structure): price breaks the previous swing high or low, a sign the current trend is likely to continue
-
CHoCH (Change of Character): price breaks a key level against the existing trend, an early sign the trend may change
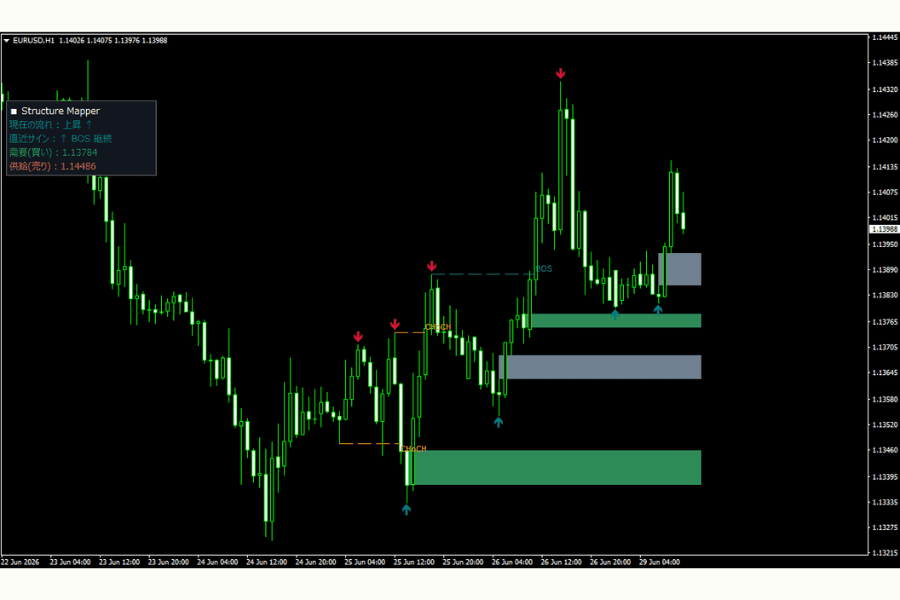
The chart also shows order block (OB) zones, which belong to a separate set of concepts. For now, focus on the highs and lows, BOS, and CHoCH. The indicator is there to help you read market conditions. It does not give buy or sell signals.
View Titan_StructureMapper3. Key Levels: Decide Where to Trade
The same candle means something very different at a key level than in the middle of nowhere. Common key levels include:
-
Horizontal support and resistance: levels where price has reversed several times
-
Previous highs and lows: the recent swing points in the structure, where stop orders often cluster
-
Trendlines and channel boundaries: support and resistance that move gradually in a trend
-
Round numbers: levels such as 155.00 on USD/JPY, where orders tend to gather
Treat these levels as zones, not exact prices. A brief move through a level that quickly reverses doesn't necessarily invalidate it. Reassess when price keeps closing outside the zone.
Mark these levels on a higher timeframe first, then watch how price reacts as it approaches them. While price is still far from a key level, you can simply stay out.
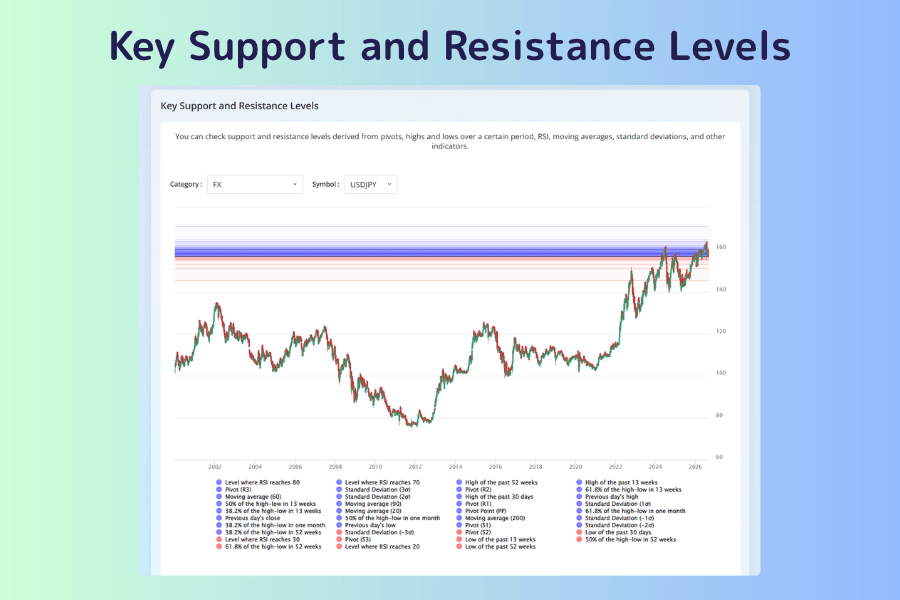
To quickly check the levels on an instrument, you can use Key Support and Resistance Levels from Titan FX. It plots levels calculated from pivots, highs and lows over a certain period, RSI, moving averages, and standard deviations.
These levels come from formulas, so they won't always match the ones you find from the highs and lows on your chart. It's worth comparing the two.
4. Price Action Signals: Candlestick Patterns and False Breakouts
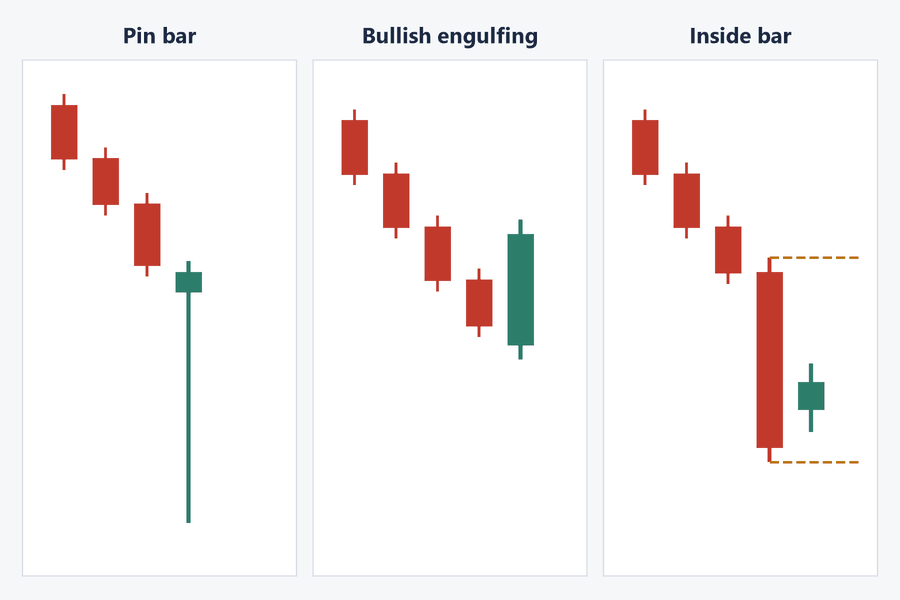
Once price reaches a key level, the shape of the candles can show whether the balance between buyers and sellers is changing. Three candlestick patterns are especially common:
| Signal | Shape | What it usually suggests |
|---|---|---|
| Pin bar | Small body with a clearly longer wick on one side (there is no standard ratio) | Price pushed in one direction and was rejected |
| Engulfing | The second candle's body completely covers the first candle's body | Control shifted quickly |
| Inside bar | The second candle's high and low stay within the first candle's range | Volatility is contracting ahead of a breakout |
For more patterns, see our guides to bullish reversal candlestick patterns and top reversal candlestick patterns.
Beyond candlestick patterns, a false breakout is another common signal. Price moves through a key level, then closes back inside it. The breakout has failed, and price may head the other way. The Titan FX indicator Titan_LiquiditySweepDetector marks suspected false breakouts on the chart with arrows.
Keep three points in mind when reading these signals:
-
Location: a pin bar with a long lower wick means more near support in an uptrend than in the middle of a range
-
Direction: signals that agree with the market structure are usually more reliable than signals against it
-
Close: a candle can change shape until it closes. What looks like a long wick may end up as a large bearish candle
5. How to Trade Price Action: A Worked Example
Putting the three building blocks together gives you this process:
-
① Read the structure: decide whether the market is in an uptrend, a downtrend, or a range, and whether to look for longs, shorts, or nothing
-
② Mark the key levels: find the support or resistance where a with-trend entry makes sense
-
③ Wait for a signal: when price reaches the level, wait for a candle to close and form a signal
-
④ Calculate the risk: place the stop loss beyond the signal candle or the swing high or low, and confirm the risk-reward ratio is worth taking
Example: hypothetical figures. USD/JPY is in an uptrend on the 1-hour chart, with a previous high at 156.75 and support below at 155.00
Signal: price pulls back to support and forms a pin bar, with a low of 154.85 and a close of 155.20
Entry: buy when the next candle breaks above the pin bar's high at 155.25
Stop: 154.75, just below the wick's low, a risk of 50 pips
Target: the previous high at 156.75, a potential gain of 150 pips, for a risk-reward ratio of 1:3
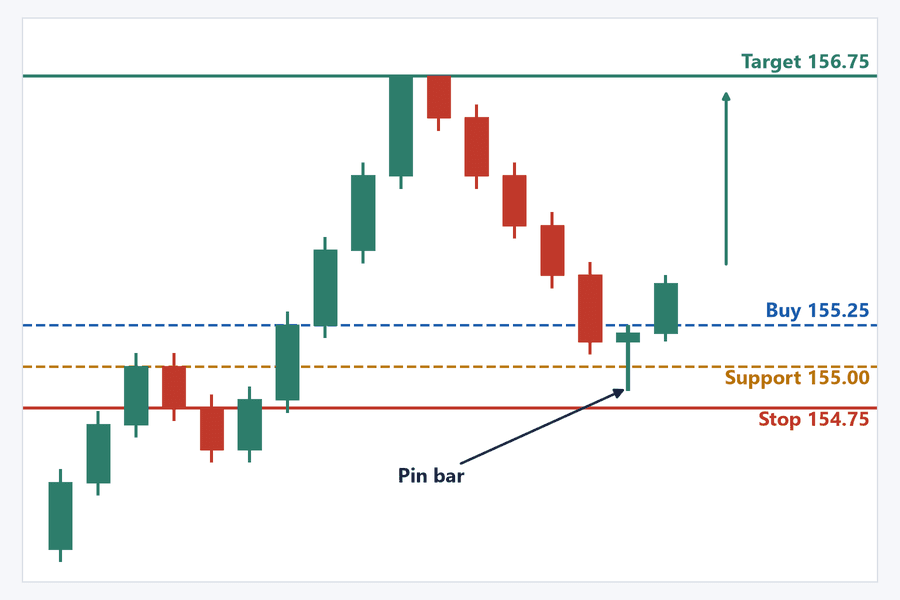
If the next candle fails to break 155.25 and instead falls below the wick's low, the signal is invalid and you stay out. It also suggests support may not hold.
The 10-pip gap between the stop and the wick's low is only for illustration. Adjust it to the instrument's volatility and the price structure. Your actual fill may also differ because of spreads and slippage.
6. Pros and Cons of Price Action Trading
| Pros | Cons |
|---|---|
| Clean charts, with no need to watch several indicators at once | Subjective; traders may read the same chart differently |
| Works across instruments and timeframes | Takes time to learn to judge signal quality |
| Stops can be based on the signal candle or structure, which makes risk easier to calculate | Some signals rely on human judgment, so they are hard to code and backtest |
| You read price movement directly, with no indicator values to interpret | Lower timeframes are noisy, and signals tend to be less reliable |
To reduce subjectivity, write down your rules, such as which timeframes and signals you use and the minimum risk-reward ratio you accept, and keep a record of every trade.
7. FAQ
Q1. Is price action suitable for beginners?
Yes, but it takes practice. Start with the 4-hour and daily charts, where candles form slowly and you have more time to think. Before trading live, test your rules on a demo account.
Q2. Which timeframe works best for price action?
It works on any timeframe, but lower timeframes tend to be noisier. A common approach is to read the structure and levels on a higher timeframe and wait for the signal on a lower one.
Q3. Is price action the same as naked trading?
They are closely related, since both read price directly. Naked trading usually means keeping almost no indicators on the chart, while price action means using price as your main evidence, not necessarily avoiding indicators altogether. Many traders add a moving average to confirm the trend or use ATR to estimate stop distance.
8. Conclusion
Price action starts with market structure, moves to key levels, and ends with candlestick signals. The three need to line up before a signal means much, because the same candle can mean different things depending on where it appears and which way the trend is going.
Before entering, place your stop beyond the structure or signal and check the risk-reward ratio. Because the method is subjective, writing down your rules and keeping records matters more than memorizing more patterns.
Further Reading
- How to Read Candlestick Charts
- Reversal Patterns: Key Features and Trading Strategies
- Trend Following in Forex
Titan FX Research Team. We cover a broad set of financial instruments — foreign exchange, commodities (crude oil, precious metals, agricultural products), equity indices, US equities, and digital assets — producing practical, research-backed educational content for traders.
Primary Sources (by Category)
- Titan FX tools: Titan FX Research Key Support and Resistance Levels; Titan_StructureMapper and Titan_LiquiditySweepDetector indicator pages (accessed November 5, 2026)
- Technical analysis methods: market structure, key levels, and candlestick signals are standard methods in technical analysis