

What Is a Price Channel? How to Draw and Trade Ascending and Descending Channels

A channel builds on a trendline. A single trendline marks support or resistance on one side only. Adding a parallel line on the other side shows the normal range of the trend and where price currently sits within it. Many charting platforms call this a parallel channel.
This guide covers the three types of channel, how to draw one, how to judge whether it is valid, how to trade inside the channel and on a breakout, how channels differ from other patterns and indicators, and the tools for drawing and detecting channels on MT4/MT5.
- A channel consists of two roughly parallel lines and comes in three types: ascending, descending and horizontal
- To draw one, connect two lows (or highs) to form the base trendline, then draw a parallel line through the high (or low) on the other side
- The more times price reacts at the lines, the more reliable the channel; very steep channels rarely last
- There are two main ways to trade a channel: with the trend inside it, or following price after a breakout
- Channel lines are parallel, while the lines of wedges and triangles converge, so they are traded differently
- 1. What Is a Price Channel? Ascending, Descending and Horizontal
- 2. How to Draw a Price Channel
- 3. How to Tell Whether a Channel Is Valid
- 4. How to Trade Inside a Price Channel
- 5. Channel Breakouts: Continuation or Reversal?
- 6. Price Channels vs. Flags, Wedges and Bollinger Bands
- 7. Drawing and Detecting Channels on MT4/MT5
- 8. FAQ
- 9. Conclusion
1. What Is a Price Channel? Ascending, Descending and Horizontal
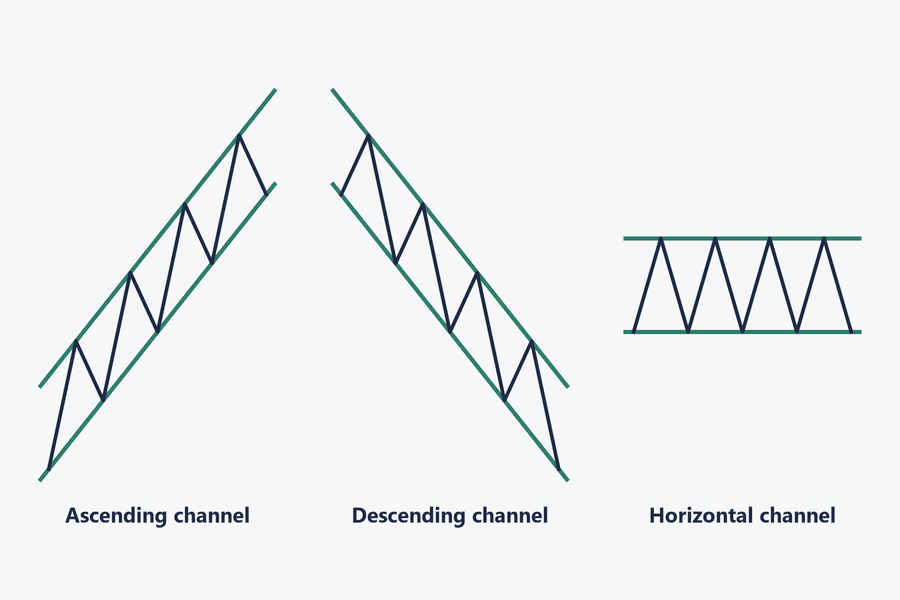
Even in a trend, price rarely moves in a straight line. It advances, pulls back, then advances again. If you connect the highs with one line and the lows with another, and the two lines run roughly parallel, price moves between them like water in a canal. That is a channel. There are three types, depending on the direction of the lines:
-
Ascending channel: highs and lows rise at a similar angle, marking an uptrend. The lower line is rising support and the upper line is rising resistance
-
Descending channel: highs and lows fall at a similar angle, marking a downtrend. The upper line is falling resistance and the lower line is falling support
-
Horizontal channel: highs and lows stay at roughly the same levels, marking consolidation or a range. The upper and lower lines are the range's resistance and support
A horizontal channel is similar to a box in box theory. This guide focuses on channels with a direction: ascending and descending.
2. How to Draw a Price Channel
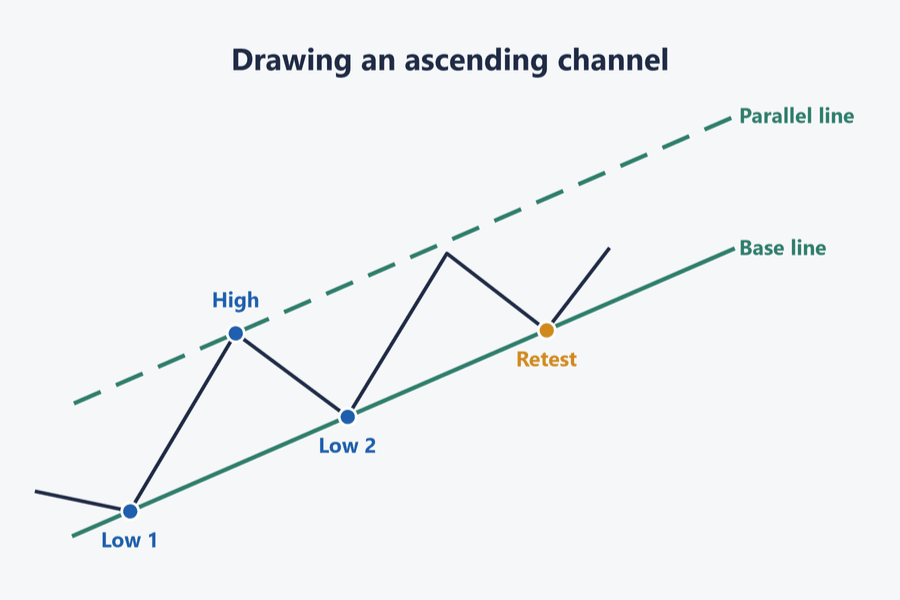
For an ascending channel, the steps are:
-
① Draw the base line: connect two rising lows to form an upward-sloping trendline
-
② Draw the parallel line: find the high between those two lows and draw a line parallel to the base line through that high
-
③ Wait for confirmation: the channel is confirmed when price touches either line again and bounces or turns back
A descending channel works the other way round: draw the base line through two falling highs, then draw the parallel line through the low between them.
Two principles apply when you draw a channel:
-
Be consistent: you can use the high and low of each candle (wicks included) or closing prices. Once you choose one, use it throughout the same chart so you are comparing like with like
-
Don't force it: if the highs clearly fall short of the parallel line, or keep overshooting it by a wide margin, the price action does not fit a channel. A forced channel will put support and resistance in the wrong places
3. How to Tell Whether a Channel Is Valid
Two parallel lines can be very different in quality. Check the following:
-
Number of valid touches: the more times price bounces or turns back at a line, the more market participants are trading around those levels and the more reliable the channel. A touch with no reaction does not count
-
Slope: a very steep channel means price is moving too fast. Such channels are usually hard to sustain, and price tends to break out of them because the move overextends
-
Width: the width sets how much room price has between the lines. A channel that is too narrow is easily broken by normal swings; one that is too wide means a larger stop distance, so you need to adjust position size accordingly
-
Timeframe: channels on daily or 4-hour charts usually get more attention from the market than those on 5-minute or 15-minute charts
4. How to Trade Inside a Price Channel
Until a channel breaks, price moves back and forth between the lines. The common approach is to trade in the direction of the channel:
-
① Ascending channel: buy when price pulls back near the lower line and shows signs of holding, using the area near the upper line as a profit target
-
② Descending channel: sell when price rallies near the upper line and shows signs of stalling, using the area near the lower line as a profit target
Some traders also trade against the channel, for example selling at the upper line of an ascending channel. The profit potential only reaches the lower line, and the stop is hit as soon as the trend continues, so the risk/reward is usually worse.
Place the stop loss outside the line, with a buffer that reflects volatility. A multiple of ATR is one way to set the distance so that a normal poke through the line does not take you out. There is no single multiple that suits every market; adjust it to the instrument's volatility, the timeframe and your trading style.
Example: hypothetical figures. EUR/USD is in an ascending channel, with the lower line at about 1.0800 and the upper line at about 1.0900
Step 1: price pulls back to 1.0805 and prints a candle that shows it holding, so you buy
Step 2: the stop goes outside the lower line at 1.0780, a risk of 25 pips
Step 3: the target goes near the upper line at 1.0890, a potential gain of 85 pips, for a risk/reward of about 1:3.4
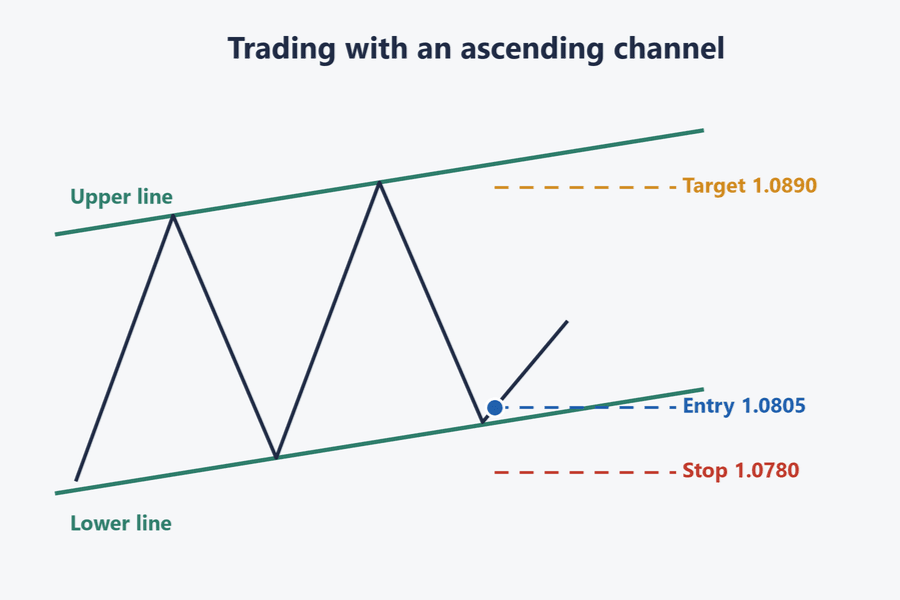
The lines of an ascending channel rise over time, so if you hold the position for several days, move the stop and target up with them.
5. Channel Breakouts: Continuation or Reversal?
Every channel breaks eventually. The direction of the break shapes how it is read:
| Situation | Common reading |
|---|---|
| Ascending channel breaks above the upper line | The rally is accelerating, though it may be a brief spike that falls back |
| Ascending channel breaks below the lower line | The uptrend may be ending or turning into a range; long positions need caution |
| Descending channel breaks above the upper line | The downtrend may be ending; a break after a long decline is often seen as a reversal signal |
| Descending channel breaks below the lower line | The decline is accelerating |
A breakout does not mean the original trend has definitely ended, nor that price will definitely keep going in the breakout direction. A break below an ascending channel can be a reversal or simply a deeper pullback.
A common way to confirm a breakout is to wait for a candle to close outside the line. Price often pokes through intraday and then closes back inside, which is a false breakout. A retest of the broken line that does not return inside the channel is another common confirmation, and a momentum indicator turning the same way can serve as a supporting check.
For a target after the breakout, traditional technical analysis measures the channel width from the breakout point in the direction of the break. For example, with the upper line at 1.0900 and a 100-pip channel, the reference target after an upside break is about 1.1000. This is a rule of thumb, not a guarantee.
6. Price Channels vs. Flags, Wedges and Bollinger Bands
Several patterns and indicators either look like a channel or have "channel" in their name. The main difference is how the lines are produced:
| Name | How the lines are drawn | Main use |
|---|---|---|
| Price channel | Drawn by hand through highs and lows; the two lines are parallel | Describes the range of a trend |
| Flag | A short, small channel against the trend after a sharp rise or fall | Judges whether the trend will continue |
| Wedge | Both lines slope the same way but gradually converge | Judges whether trend momentum is fading |
| Triangle | The two lines converge toward one point | Judges the breakout direction after consolidation |
| Donchian Channel | Highest high and lowest low over a set period | Breakout trading |
| Bollinger Bands | Moving average plus and minus standard deviations; the bands widen and narrow with volatility and are not necessarily parallel | Tracks volatility expanding or contracting |
Like flags, wedges and triangles, a price channel is drawn by the trader from highs and lows. Donchian Channels and Bollinger Bands are calculated by formula, so they look the same no matter who plots them. Some platforms also offer an indicator called "Price Channel" that plots the highest high and lowest low over a period; it works like a Donchian Channel and is not the hand-drawn pattern described in this guide.
7. Drawing and Detecting Channels on MT4/MT5
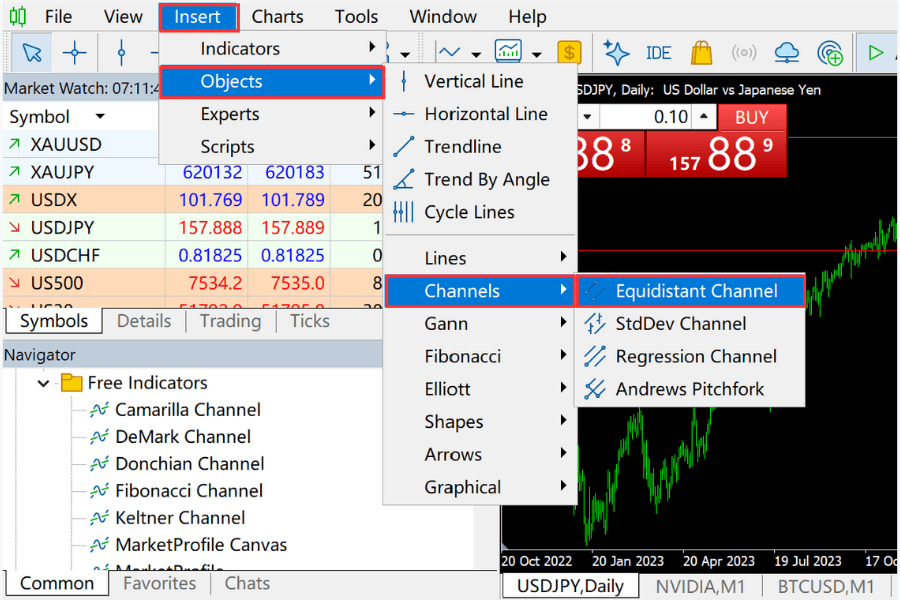
Drawing a channel by hand on MT5
On MT4/MT5, channels are objects, like trendlines, so you will not find them in the indicator list. On MT5, go to Insert → Objects → Channels and choose Equidistant Channel. Drag out the base line on the chart, then move the second line to the high or low on the other side.
Titan_Regression_Channel: plotting a linear regression channel automatically
Titan_Regression_Channel, a custom indicator provided by Titan FX, calculates a linear regression line over a set number of candles and draws lines above and below it at the maximum statistical deviation. The default range is 50 candles, and you can base it on closing prices or on highs and lows.
A regression channel is calculated by a statistical formula, so unlike a hand-drawn price channel, it does not depend on who draws it. Overlaying regression channels with different ranges lets you compare short-, medium- and long-term trends at once.
The indicator works only on Titan FX's Windows versions of MT4/MT5.
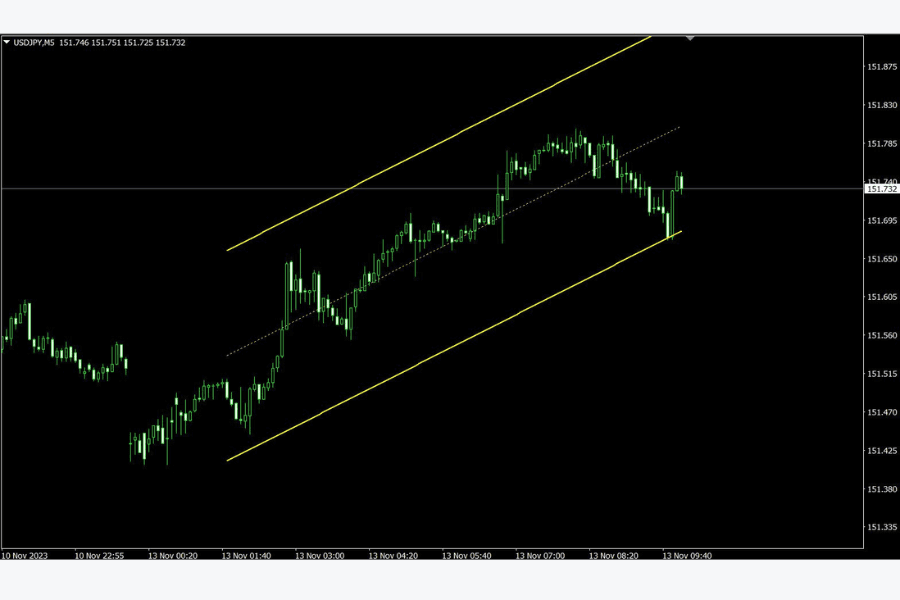
Chart Pattern Scanner: detecting rising and falling channels automatically
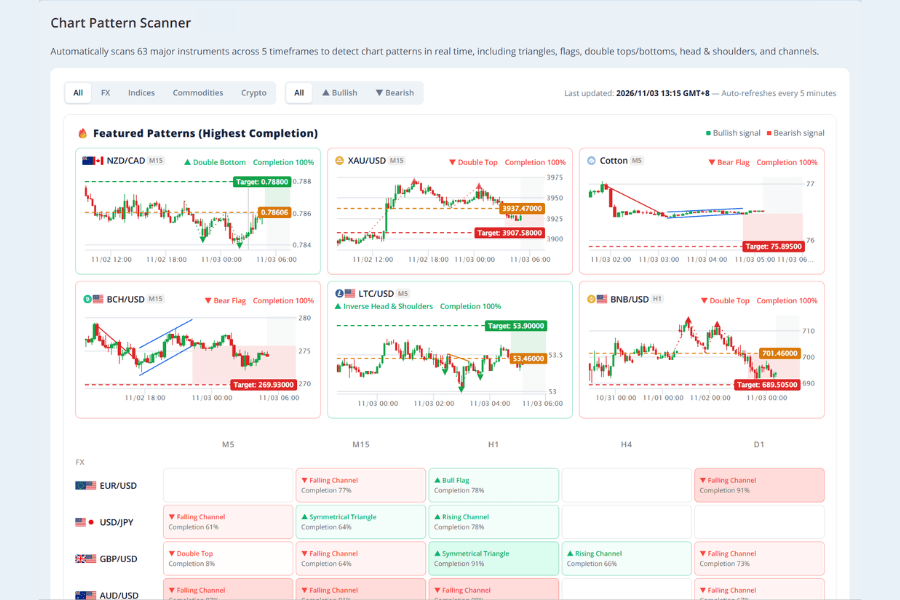
The Chart Pattern Scanner automatically scans 63 instruments across 5 timeframes and detects chart patterns, including rising and falling channels. The scanner table marks bullish patterns in green and bearish patterns in red, and clicking a cell opens a candlestick chart with the lines drawn in.
8. FAQ
Q1. Should I draw a channel with wicks or closing prices?
Either works. A channel drawn with highs and lows (wicks included) is wider and contains every move. A channel drawn with closing prices is narrower and less affected by intraday spikes. Pick one and use it consistently on the same chart.
Q2. What is the midline of a channel used for?
The midline is a parallel line drawn exactly halfway between the upper and lower lines. Price above the midline is on the stronger side of the channel. Traders also often use the midline as a first profit target for trades inside the channel, or as initial support on a pullback.
Q3. What does "completion" mean for a channel in the Chart Pattern Scanner?
In the scanner, completion usually shows how close a pattern is to breaking out. Channels have no breakout concept, so for a channel, completion measures trend clarity, capped at 99%. The scanner does not calculate a target price for channels or include them in success-rate tracking.
Q4. Can I redraw a channel after it breaks?
Yes. A break means the rhythm of the move has changed, so redraw the lines using the new highs and lows after the break. If the new channel is clearly less steep, the trend is often losing pace.
9. Conclusion
A price channel uses two parallel lines to describe the range of a trend. Ascending and descending channels correspond to uptrends and downtrends. The more valid touches a channel has, the more reliable it is, while very steep channels are hard to sustain.
Inside a channel, the usual approach is to enter near a line in the direction of the trend and place the stop outside it. When a channel breaks, confirm it on a closing basis and watch for false breakouts. Besides drawing channels by hand, you can use Titan_Regression_Channel and the Chart Pattern Scanner to support your analysis.
Further Reading
- Continuation Patterns: Features and Strategies
- Reversal Patterns: Key Features and Trading Strategies
- 6 Practical Bollinger Bands Trading Strategies
Titan FX Research Team. We cover a broad set of financial instruments — foreign exchange, commodities (crude oil, precious metals, agricultural products), equity indices, US equities, and digital assets — producing practical, research-backed educational content for traders.
Primary Sources (by Category)
- Titan FX tools: Titan FX Research Chart Pattern Scanner user guide; Titan_Regression_Channel indicator page
- Platform documentation: MetaTrader 5 Help, "Equidistant Channel"
- Technical analysis methods: drawing, confirming and measuring channels are standard methods in traditional technical analysis