
 Home
- Investment Guide: Strategies for Stocks, Forex, and Metals
- How Does CPI Affect Forex? The Dollar After a CPI Surprise
How Does CPI Affect Forex? What Happens to the Dollar After a CPI Surprise

How the dollar moves afterward depends mainly on the surprise, the gap between the actual figure and the consensus forecast: a hotter-than-expected print tends to lift the dollar, and a cooler one tends to weigh on it.
Every release, though, contains four numbers at once: headline CPI and core CPI, which excludes food and energy, each on a month-over-month and a year-over-year basis. The four do not always beat or miss together, and the size of the reaction also depends on what the market already expects from the Federal Reserve.
The direction in the first minute is not always the direction 30 minutes later, or at the close.
This guide explains when U.S. CPI is released and what the four numbers are, then uses three real releases to show the three ways USD/JPY typically reacts. It also shows how to check past reactions in the Titan FX Economic Calendar and how to look up the release day and the following day in the Exchange Rate Historical Database.
- A hotter-than-expected CPI tends to push USD/JPY up and EUR/USD down; a cooler one tends to do the opposite
- Three common patterns: the move continues, the first move reverses within 30 minutes, or there is almost no reaction
- U.S. CPI is released at 8:30 a.m. Eastern Time: 8:30 p.m. UTC+8 during U.S. daylight saving time and 9:30 p.m. UTC+8 in winter
- The four numbers come out together, so all four rows in the Economic Calendar show the same price change, and you cannot tell which number drove the move
- Before the release, check past reactions in the Economic Calendar; afterward, confirm the day's close and the next day's close in the Exchange Rate Historical Database
- 1. When Is U.S. CPI Released, and What Are the Four Numbers?
- 2. How Does the Dollar React After CPI? Three Common Patterns
- 3. Why the Surprise Matters More Than the Number
- 4. One Minute vs. 30 Minutes: Why the First Move Can Reverse
- 5. Checking the Release Day and the Next Day in the Exchange Rate Historical Database
- 6. How to Prepare Before a CPI Release
- 7. FAQ
- 8. Conclusion
1. When Is U.S. CPI Released, and What Are the Four Numbers?
CPI measures changes in the prices consumers pay for goods and services, and it is the main gauge of inflation. The BLS releases the previous month's CPI around the middle of each month, always at 8:30 a.m. Eastern Time, on the U.S. calendar date.
U.S. daylight saving time runs from the second Sunday in March to the first Sunday in November. In UTC+8, that puts the release at 8:30 p.m. during daylight saving time and 9:30 p.m. in winter.
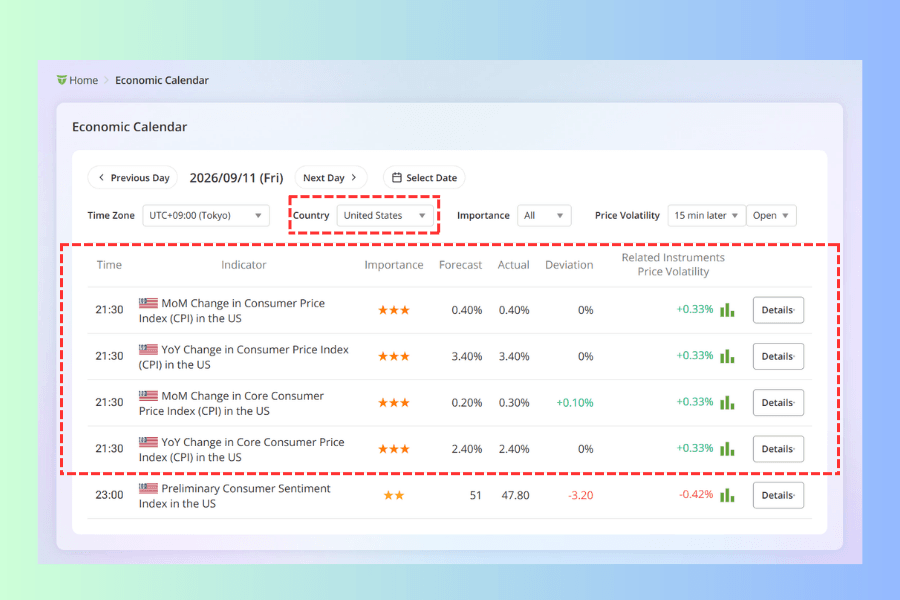
In the Economic Calendar, set Country to United States and you will see four rows at the same time on CPI day, each rated three stars. The times shown follow the Time Zone setting at the top left; the screenshot below uses UTC+09:00 (Tokyo), so the release appears at 21:30.
-
MoM Change in Consumer Price Index (CPI) in the US: how much overall prices changed from the previous month
-
YoY Change in Consumer Price Index (CPI) in the US: how much overall prices changed from a year earlier; this is the figure headlines quote most often
-
MoM Change in Core Consumer Price Index (CPI) in the US: the month-over-month change excluding food and energy
-
YoY Change in Core Consumer Price Index (CPI) in the US: the year-over-year change excluding food and energy
Food and energy prices swing a lot, so core CPI gives a clearer view of underlying inflation, and markets watch it alongside headline CPI.
One more detail: the month-over-month figures are seasonally adjusted, while the year-over-year figures are calculated from indexes before seasonal adjustment, so the two are not computed on the same basis. For definitions and the calculation method, see our CPI glossary entry.
2. How Does the Dollar React After CPI? Three Common Patterns
A hotter-than-expected CPI means prices are rising faster than the market thought. That makes it harder for the Fed to cut rates, which tends to support the dollar. A cooler print works the other way. With no other major news in play, the typical directions are:
| Pair or instrument | CPI above forecast | CPI below forecast |
|---|---|---|
| USD/JPY | Tends to rise | Tends to fall |
| EUR/USD | Tends to fall | Tends to rise |
| Gold (XAU/USD) | Tends to fall | Tends to rise |
Gold also responds to real interest rates and safe-haven demand, so it does not always follow this table.
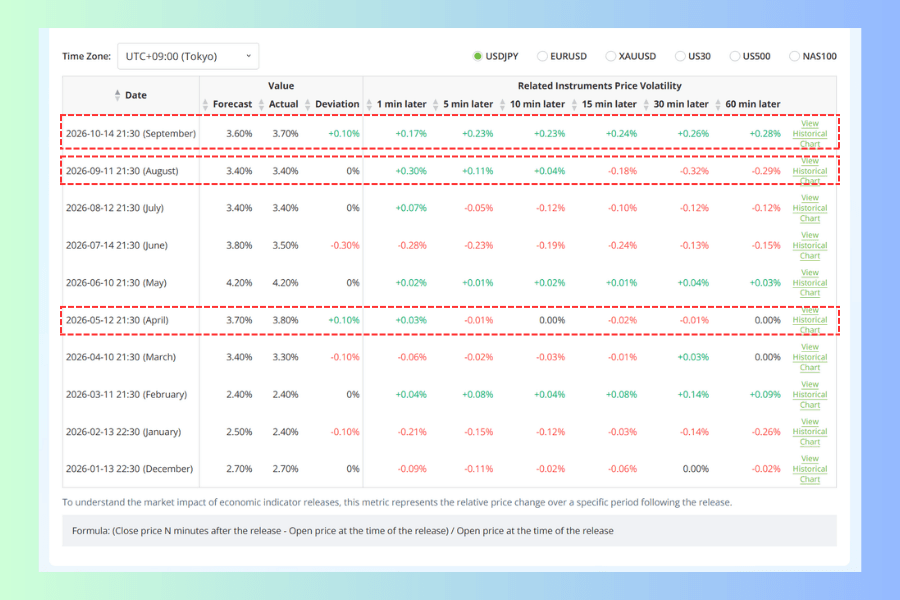
In practice, USD/JPY tends to react in one of three ways. The table below shows three releases recorded in the Economic Calendar. "Versus forecast" compares each of the four numbers from Section 1 with its forecast, and the price changes are measured from the price at the moment of release.
| Release date (data month) | Versus forecast | 1 min later | 30 min later | Pattern |
|---|---|---|---|---|
| October 14, 2026 (September) | 3 above, 1 in line | +0.17% | +0.26% | Move continued |
| September 11, 2026 (August) | 1 above, 3 in line | +0.30% | -0.32% | First move reversed |
| May 12, 2026 (April) | 3 above, 1 in line | +0.03% | -0.01% | Almost no reaction |
In October and May, three of the four numbers came in above forecast. In October the dollar kept strengthening; in May it barely moved. A hot print tells you which way the dollar is more likely to go, not that a big move is coming.
In September, only one number beat the forecast. USD/JPY rose at first, then traded below its pre-release level 30 minutes later.
3. Why the Surprise Matters More Than the Number
Before the release, the market already has an expectation for CPI, and that is what the Economic Calendar shows as the Forecast. If the actual figure lands close to it, the market is prepared and prices tend not to move much. What moves prices is the gap between the two, shown as Deviation (Actual minus Forecast).
Say year-over-year CPI rises from 3.4% the previous month to 3.7%. That looks like a big jump. But if the market was already expecting 3.7%, the deviation is zero and the dollar may not rise at all.
Click Details on the right of a CPI row and the calendar expands about ten past releases, with the forecast, the actual figure and the price change at several points after each release. You can choose one related instrument at a time above the table, so check which one is selected before you read the numbers.
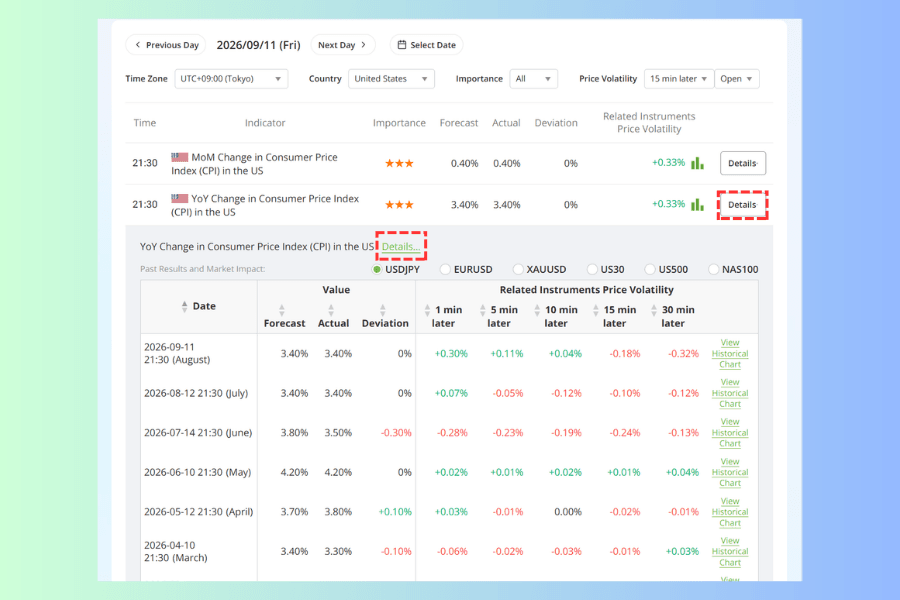
Note that this panel only lists releases up to the date you are viewing. With the calendar set to September 11, the October 14 release does not appear. To see the latest ten, click Details... next to the indicator name at the top of the panel to open the indicator's own page, which also adds a 60-minute column.
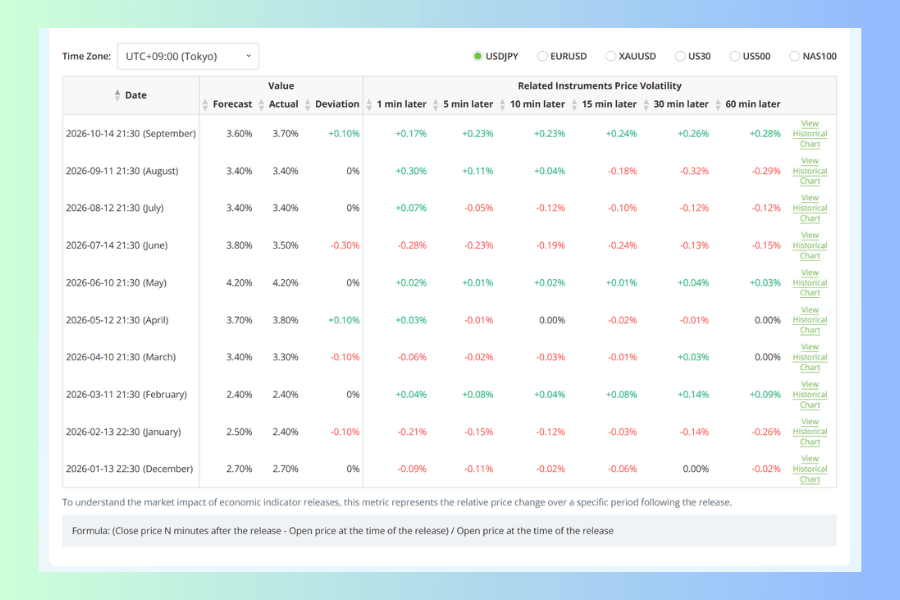
The numbers in Section 2 come from this table. The formula below it reads: (Close price N minutes after the release - Open price at the time of the release) / Open price at the time of the release. So the "30 min later" figure already includes the first minute's move; it is not a separate move.
The table also has a cooler-than-expected example. On July 14, 2026 (June data), year-over-year CPI was forecast at 3.8% and came in at 3.5%, and USD/JPY fell 0.28% in the first minute, in line with the direction table in Section 2.
4. One Minute vs. 30 Minutes: Why the First Move Can Reverse
All four CPI numbers come out in the same minute, so the four rows in the Economic Calendar show exactly the same price change. That figure is the market's reaction to the release as a whole; it cannot tell you which number drove the move.
When the four numbers point in different directions, the first move is more likely to reverse. The September 11, 2026 release is an example:
-
Headline CPI, both month-over-month and year-over-year, matched the forecast
-
Core CPI month-over-month came in at 0.3%, above the 0.2% forecast; core CPI year-over-year matched the forecast
-
USD/JPY rose 0.30% in the first minute, but was down 0.32% after 30 minutes
The September 11 row in the table in Section 3 shows the fade step by step: +0.30% after 1 minute, +0.11% after 5, +0.04% after 10, then -0.18% after 15 and -0.32% after 30. If you looked only at the first minute, you would conclude the dollar had strengthened.
So when you read past releases, look at the 1-minute and 30-minute figures together:
-
Same direction at both points: the reaction was consistent, as on October 14
-
Opposite directions: the first move did not hold, as on September 11, and a trade entered on that move could easily have been stopped out
-
Both close to zero: the release had little effect on that instrument, as on May 12
5. Checking the Release Day and the Next Day in the Exchange Rate Historical Database
The Economic Calendar's price changes go out to 60 minutes after the release. To see where the pair closed on CPI day, and whether the move carried into the next day, use the Exchange Rate Historical Database:
-
① Choose a currency pair, for example USDJPY
-
② Open the month of the release; the top of the page shows the monthly high and low with their dates
-
③ Click the release day and the following day to compare the open, high, low and close
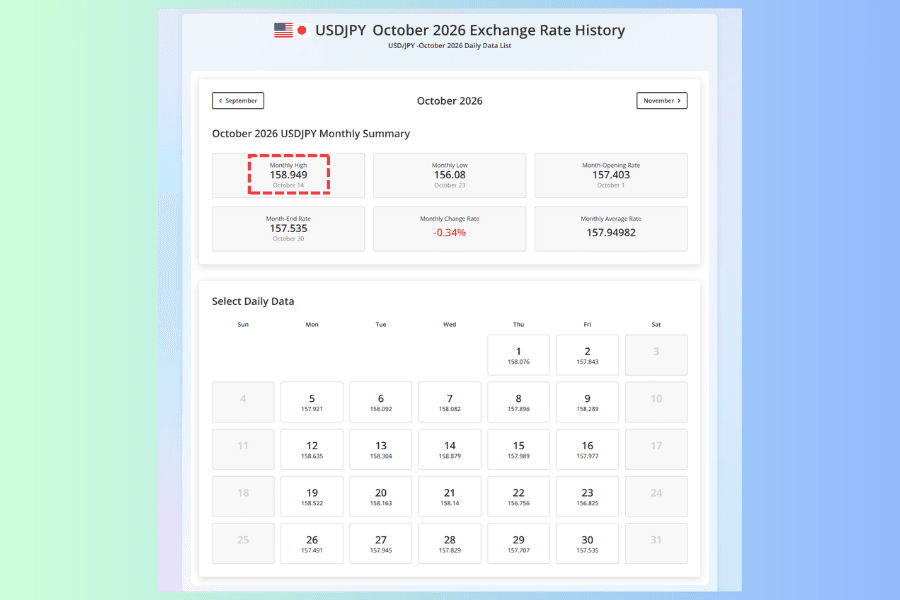
For USD/JPY in October 2026, the monthly high of 158.949 came on October 14, the day CPI was released. The pair closed that day at 158.879, up 0.36% from the previous day.
The next day, October 15, it closed at 157.989, down 0.56%, giving back all of the October 14 gain.
A daily high and low cover the whole trading day, and other news also hits the market that day, so not all of the move can be put down to CPI. For the reaction in the first few minutes, go back to the price changes in the Economic Calendar.
Open the Exchange Rate Historical Database6. How to Prepare Before a CPI Release
Putting these checks together, here is a sequence to follow before CPI:
-
① Confirm the time: find the release date in the Economic Calendar and allow for the daylight saving time shift
-
② Note the forecasts and rate expectations: write down the forecasts for all four numbers and get a sense of what the market expects from the Fed's next decision. The same CPI result can produce a different reaction when the market expects a cut than when it expects the Fed to hold
-
③ Check past reactions: open Details, select the instrument you hold and look at the 1-minute and 30-minute changes for the last few releases
-
④ Adjust your position: if a move of that size could push your current position past the loss you are willing to accept, reduce it before the release or set your stop loss at a sensible level
At the moment of release, the spread can widen and prices can gap or slip, so a stop loss is not guaranteed to fill at the price you set. For the calendar's other columns and filters, see our guide to the Economic Calendar.
Open the Economic Calendar How to Read the Economic Calendar7. FAQ
Q1. What day of the month is U.S. CPI released?
The BLS sets the dates in advance. Releases usually fall around the middle of the month, but the exact date changes from month to month. The BLS website lists upcoming release dates, and the Economic Calendar shows them ahead of time.
Q2. Why does the dollar move when CPI matches the forecast?
Because each release has four numbers. The year-over-year figure in the headlines can match the forecast while the others come in above or below. On September 11, 2026, headline CPI was in line, but core CPI month-over-month beat the forecast, and USD/JPY went from up to down within 30 minutes.
Q3. Is there a way to estimate CPI before the release?
The Cleveland Fed's Inflation Nowcasting is one reference. It updates model-based estimates of CPI and core CPI every day until the official data come out. These are model estimates, not the market consensus shown as the forecast in the Economic Calendar, so one cannot stand in for the other.
8. Conclusion
Whether CPI comes in hot or cool tells you which way the dollar is more likely to move. The actual reaction can continue, reverse within 30 minutes or barely register, and the first move is especially prone to reversing when the four numbers disagree.
Before the release, use the Economic Calendar to confirm the time, the forecasts and past reactions. Afterward, read the 1-minute and 30-minute changes together, then check the day's close and the next day's close in the Exchange Rate Historical Database. That tells you far more about whether a move has held than the first minute alone.
Further Reading
- News Trading Explained: How It Works, Key Events and Risk Management
- FOMC Meeting Schedule and Rate Decisions
- USD/JPY Trading Guide
Titan FX Research Team. We cover a broad set of financial instruments — foreign exchange, commodities (crude oil, precious metals, agricultural products), equity indices, US equities, and digital assets — producing practical, research-backed educational content for traders.
Primary Sources (by Category)
- Official statistics: U.S. Bureau of Labor Statistics (BLS) CPI release schedule and September 2026 CPI news release
- Titan FX tools: Economic Calendar (past releases and price changes for the four U.S. CPI rows) and Exchange Rate Historical Database (USDJPY daily data for October 2026), viewed November 4, 2026