
 Home
- Investment Guide: Strategies for Stocks, Forex, and Metals
- How US Midterm Elections Affect Stocks and the Dollar
How US Midterm Elections Affect Stocks and the Dollar: What History Shows
The US midterm elections are the congressional elections held halfway through a four-year presidential term, covering every seat in the House of Representatives, about a third of the Senate and most state governorships. The 2026 midterms take place on November 3.
The results decide which party controls Congress for the next two years, and with it the direction of the budget, taxes and the debt ceiling, all issues that matter directly to markets. Every midterm year, sayings such as "stocks rally after the midterms" start doing the rounds again.
This article makes no prediction about the outcome and takes no political side. It looks only at the market angle: what the midterms decide, how US stocks and the dollar have behaved around past elections, what actually happened in 2018 and 2022, and the dates and tools traders may want to watch around the 2026 vote.
- The midterms decide control of Congress; what markets watch is the fiscal policy that follows
- By several firms' counts, US stocks have risen in the 12 months after every midterm since 1950, but that is a sample of only 19
- Stocks rose in the 12 months after both the 2018 and 2022 midterms, yet the election months themselves were unremarkable within each year
- In 2022, the dollar's biggest move in the week after the vote came on the day an inflation report was released
- In 2026 the Fed meets the week before the election and the jobs report lands three days after it, so data may matter more than the vote itself
- 1. What are the US midterm elections, and what is on the ballot in 2026?
- 2. US stocks around midterm elections: the historical pattern
- 3. 2018 and 2022: different forces drove the post-election market
- 4. The dollar and FX: the election effect is easily drowned out by data
- 5. How traders can watch the 2026 midterms: dates and tools
- 6. Frequently Asked Questions
- 7. Summary
1. What are the US midterm elections, and what is on the ballot in 2026?
A US president serves a four-year term, while Congress is elected every two years. Congressional elections held in the same year as a presidential race are presidential-year elections; those held halfway through the term are the midterms. Here is what is on the ballot on November 3, 2026:
| On the ballot | Seats | Term |
|---|---|---|
| House of Representatives | All 435 seats | 2 years |
| Senate | 35 seats (33 regularly scheduled plus 2 special elections) | 6 years |
| Governors | 36 states | Mostly 4 years |
The new Congress is sworn in in January 2027.
Markets care about the midterms because of what Congress controls. The federal budget, tax law and the debt ceiling all need congressional approval, so which party holds Congress shapes the path of federal spending and the deficit over the next two years, and from there Treasury yields and the dollar.
When the president's party holds both chambers, its agenda is easier to pass. When the other party controls at least one chamber, new fiscal legislation usually becomes harder to pass, a situation markets call divided government.
What markets react to is how far the result differs from what was expected, and whether the direction of spending, regulation and taxes is likely to change.
Monetary policy, on the other hand, is set by the Federal Reserve, which is not on the ballot. The path of interest rates, the biggest driver of currency and bond markets, is still led by economic data before and after the vote.
2. US stocks around midterm elections: the historical pattern
The most widely quoted midterm statistic is how the S&P 500 performs in the 12 months after the vote. According to counts by several brokers and research firms, the S&P 500 has been higher 12 months later after all 19 midterm elections since 1950, with an average gain of around 15%. The exact figure varies with the starting point and method used.
The pattern is often discussed alongside the presidential election cycle: over a four-year term, US stocks have historically been relatively weak and more volatile in the midterm year, and relatively strong from the post-election period through the third year. A common explanation is that policy uncertainty clears once the election is over and money returns to the market.
Three things are worth keeping in mind when reading these numbers:
- The sample is small: 19 elections means only 19 observations, each in a different economic setting.
- It overlaps with the rate cycle: several post-election rallies coincided with the Fed pausing or starting to cut rates, so the gains cannot all be credited to the election.
- The past does not guarantee the future: valuations, rates and fiscal conditions differ from earlier cycles, and any streak can end.
For the composition and characteristics of the S&P 500 (US500), see our dedicated guide.
3. 2018 and 2022: different forces drove the post-election market
The two most recent midterms were held on November 6, 2018 and November 8, 2022. Choose US500 in Seasonality Analysis, and the "Year × month heat map" shows the monthly change for both years (based on month-end closes).
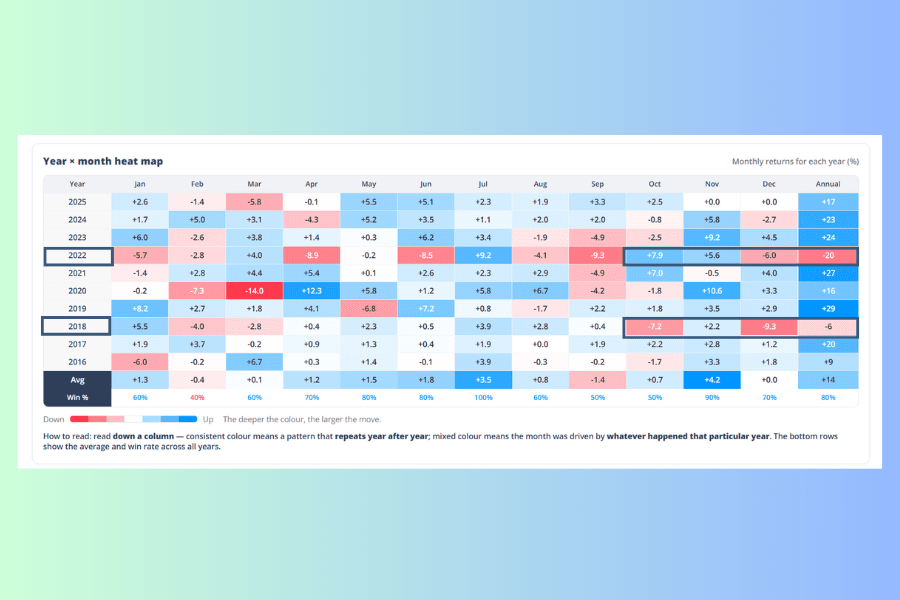
| 2018 | 2022 | |
|---|---|---|
| January to October of the election year | +1.0% | −18.9% |
| October | −7.2% | +7.9% |
| November (election month) | +2.2% | +5.6% |
| December | −9.3% | −6.0% |
| 12 months after the election (end of October to end of October) | +12.3% | +8.0% |
Note: multi-month changes compound the monthly returns rather than adding them, using month-end closes. "12 months after the election" runs from the end of October to the end of the following October, not from election day. Full-year figures calculated the same way match the "Annual" column on the right of the heat map.
Both years saw gains in the 12 months after the vote, in line with the historical pattern. But the election months on their own do not show the election producing an unusual move:
- 2018: November, the election month, rose only 2.2%, ninth largest of the year's 12 months and below that year's average monthly move of about 3.4%. The big moves came in October (−7.2%) and December (−9.3%), when the Fed was still raising rates and markets were also worried about trade tensions and slowing growth.
- 2022: eight of the year's 12 months moved by more than 5%, and the election month's +5.6% ranked only eighth. The rebound from October onward came from bets that inflation had peaked and rate hikes would slow, helped along by a softer-than-expected CPI report on November 10. In December, the Fed signaled that rates would stay high for longer, and stocks fell again.
In the weeks after the results came in, rates and the economy were still driving the market. For a fuller ten-year test of monthly patterns, see Do Seasonal Patterns Still Hold?
Open Seasonality Analysis4. The dollar and FX: the election effect is easily drowned out by data
The midterms affect the dollar only indirectly. A change in the makeup of Congress shifts fiscal policy expectations, those expectations feed through to Treasury supply and yields, and only then does the effect reach the dollar. Along that chain, Fed policy and economic data are usually the bigger variables.
Take 2022 as an example. In the Exchange Rate Historical Database, here are the daily USD/JPY closes for November 2022:
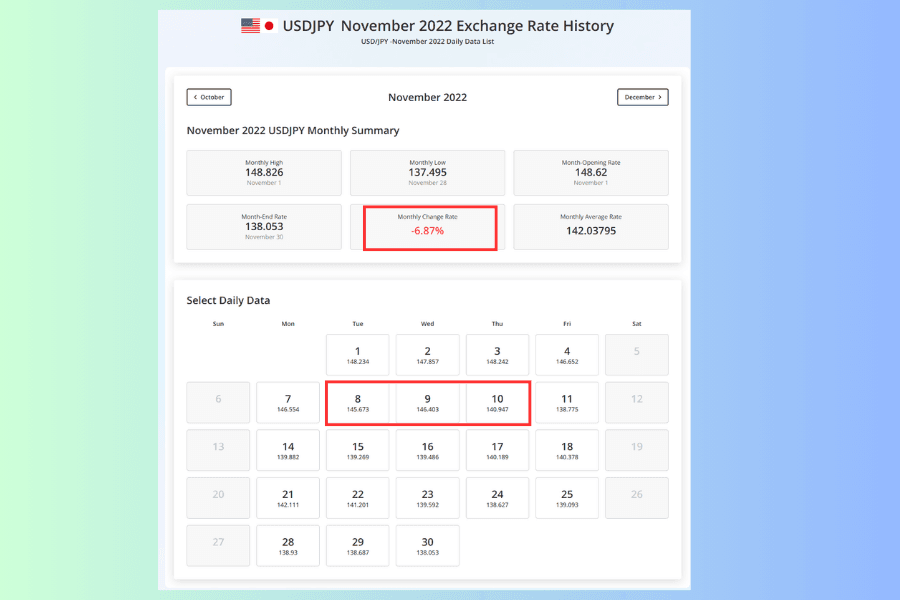
| Date | Event | USD/JPY close | Change from previous day |
|---|---|---|---|
| November 8 | Midterm election day | 145.673 | |
| November 9 | Results come in | 146.403 | about +0.5% |
| November 10 | US October CPI comes in below expectations | 140.947 | about −3.7% |
On the day the results came in, USD/JPY moved only about 0.5%. Two days later, the CPI (Consumer Price Index) report knocked it down about 3.7% in a single day, and the pair fell 6.87% over the whole of November. What the market reacted to was how the inflation data would affect the pace of Fed hikes; the election result itself had a limited effect.
If an election outcome differs sharply from expectations, or shifts the outlook for fiscal or trade policy in a major way, the dollar and Treasuries can still move significantly. For more on the US Dollar Index and the characteristics of USD/JPY, see our dedicated guides.
Open the Exchange Rate Historical Database5. How traders can watch the 2026 midterms: dates and tools
For the 2026 vote, several market-moving events fall within a week either side of election day (times are US Eastern):
| Date | Event | Why it matters |
|---|---|---|
| October 27–28 (decision at 2:00 p.m. on the 28th) | FOMC meeting | The Fed's last meeting before the election, shaping rate expectations for the weeks after |
| November 3 | Midterm election day | Polls close from 7:00 p.m. Eastern and counting continues overnight |
| November 4 | ADP employment report and other data | A preview of the official jobs report |
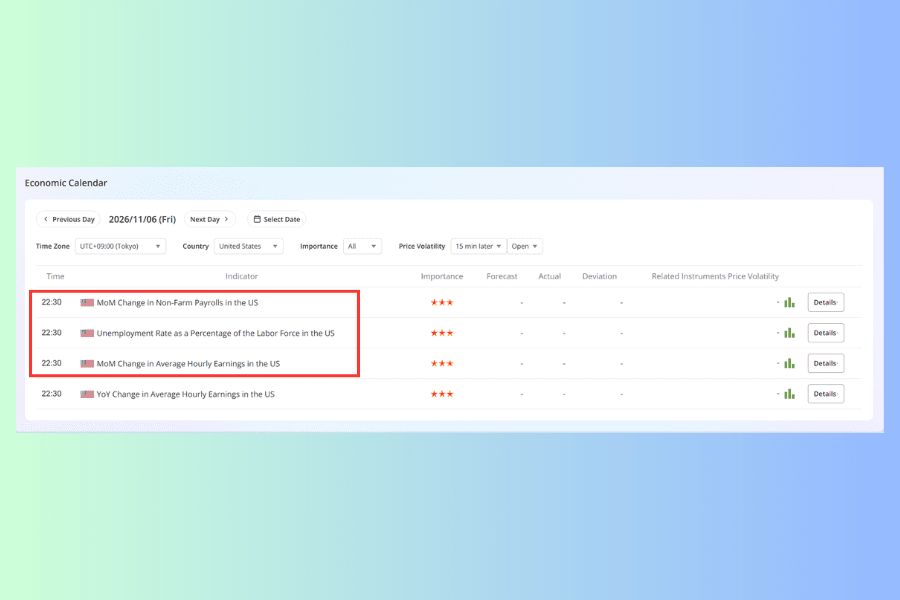
| November 6, 8:30 a.m. | US nonfarm payrolls report | The first major data release after the vote |
Note: dates follow the Federal Reserve's published 2026 FOMC schedule and the US Bureau of Labor Statistics (BLS) release calendar. Check the official announcements for any changes.
The decisions from each Fed meeting and the date of the next one are listed in Central Bank Watch, and our FOMC 2026 schedule covers the full year. Release times and forecasts for each indicator are in the Economic Calendar; filter by United States and three-star importance to see them.
Counting runs through the US evening and night, which falls on the morning of November 4 in Asian time zones. Some races may take days to call, and while results trickle in, volatility can rise and spreads can widen. If you do not plan to trade the election, it can make sense to reduce positions before the vote, check your stop-loss levels and stay out during the hours when the outcome is unclear.
Open the Economic Calendar6. Frequently Asked Questions
Q1: Do the midterms affect Fed decisions?
The Fed bases its rate decisions on inflation and employment data and is institutionally independent of congressional elections. An election can affect the economic outlook indirectly through fiscal policy expectations, but it does not change how the Fed makes its decisions.
Q2: Is divided government good or bad for markets?
There is no settled answer. One common view is that markets like divided government because new legislation is harder to pass and policy is more stable. On the other hand, gridlock can delay the budget or the debt ceiling and cause volatility as deadlines approach. Historical data cannot prove that one combination is always better.
Q3: Do US stocks always rise after the midterms?
Not necessarily. Stocks have been higher 12 months after every midterm since 1950, but that is only 19 cases, and short-term moves after the vote tend to be driven by rates and the economy. In 2018, stocks fell sharply little more than a month after the election. The statistic is a reference point, not a rule.
Q4: Do the midterms affect gold?
Mostly indirectly. Gold tends to track the dollar, real interest rates and safe-haven demand. If the election changes expectations for the deficit and Treasury issuance, that can feed through to gold via the dollar and yields. The election result itself rarely sets gold's direction.
Q5: Which assets are most sensitive to the election?
Sectors closely tied to policy usually react most directly, such as healthcare, energy, defense and financials. Indices and major currency pairs are less affected by the election itself and tend to follow rate expectations and economic data.
Q6: How long does it take for the results to be known?
Most races are called on election night or the next day, and control of Congress is usually clear within a few days. Close races can take longer to count or go to a recount, and it is not unusual for individual seats to take weeks to settle.
7. Summary
The midterms decide control of Congress, and what markets really care about is how that affects fiscal policy, Treasury supply and yields. US stocks have risen in the 12 months after every midterm on record, but that statistic rests on just 19 cases, many of which overlap with the Fed's rate cycle.
Both the 2018 and 2022 elections show rates and economic data driving the market in the weeks after the vote. In 2026, the Fed meets the week before the election and the jobs report lands three days after it. Building those dates into your trading plan will do more for position management than trying to call the result.
Further Reading
- What is Forex Fundamental Analysis?
- Nasdaq 100 (NAS100) Guide: Components & Trading
- How to Read the Economic Calendar: Filters and Columns
- Tariff
The financial markets research team at Titan FX. We produce educational content for investors across a broad range of instruments, including foreign exchange, commodities such as crude oil, precious metals and agricultural products, equity indices, US stocks and digital assets.
Primary Sources (by Category)
- Election rules: Federal Election Commission; official guidance from the US Senate and House of Representatives
- Official schedules: Federal Reserve FOMC meeting calendar; US Bureau of Labor Statistics release schedule
- Market statistics: compilations of post-midterm S&P 500 performance by brokers and research firms (Deutsche Bank, BNY and others)
- Pages and tools: Titan FX Research Seasonality Analysis (US500, monthly returns 2016 to 2025), Exchange Rate Historical Database (USD/JPY, November 2022), Economic Calendar, Central Bank Watch (screen data as of October 12, 2026)