ADR
In stock and FX trading, understanding the broader mood of the market matters as much as tracking the headline index. Many investors focus on the index level or individual stock prices, but the index can mask a divergence between the surface trend and the actual breadth of participation.
A classic case: the index closes higher even as the majority of stocks decline. That internal weakness is invisible if you only look at the index — and it often leads to mistimed entries.
This is where the Advance-Decline Ratio (ADR) becomes useful. By comparing the number of advancing stocks against the number of declining stocks, the ADR provides an instant read on whether the market is overheating or being oversold.
While the ADR was designed for equity markets, you can pair it with the Titan FX Percentage Change Ranking tool to track daily movers across FX, indices, US stocks, and commodities in a single view.
This guide walks through the definition, calculation, interpretation thresholds, common pitfalls, and how the ADR fits with other market breadth tools like the Advance/Decline Line and OBOS.
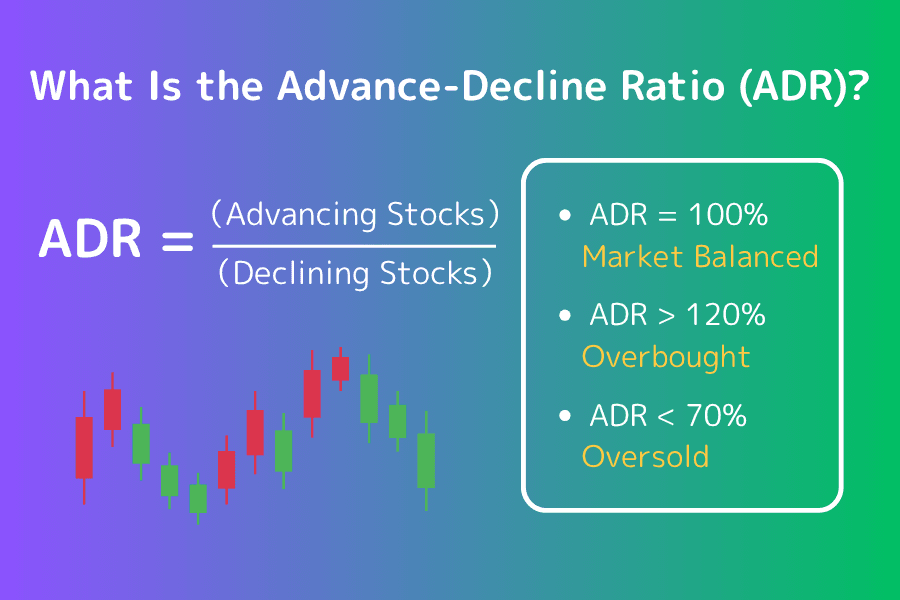
- ADR measures market breadth. Advancing stocks ÷ declining stocks, expressed as a percentage.
- Two thresholds matter. Above 120% = overheated, below 70% = oversold.
- Stock count only. ADR ignores magnitude — a 0.1% advance and a 10% advance both count as one.
- Not for single stocks. Use the ADR for the whole market, not for individual position timing.
- Pair with other tools. Combine with MA, RSI, MACD for reliable signals; in FX use the Titan FX ranking tool.
1. What Is the Advance-Decline Ratio (ADR)?
The Advance-Decline Ratio (ADR) is a market breadth indicator that gauges whether market sentiment is tilted bullish or bearish. By comparing the number of advancing stocks to declining stocks, the ADR tells you whether participation is broadening or narrowing under the index's headline move.
Key characteristics:
- It focuses on the number of stocks, not the size of their moves.
- It reveals the internal structure of a market and helps catch turning points the index alone misses.
In short, the ADR is the temperature reading for overall market health.
| ADR Reading | Ratio | Interpretation |
|---|---|---|
| ADR = 100% | Ratio = 1 | Balanced — equal number of advancers and decliners |
| ADR > 120% | Ratio > 1.2 | Overheated — short-term pullback risk |
| ADR < 70% | Ratio < 0.7 | Oversold — short-term bounce potential |
How to calculate the ADR
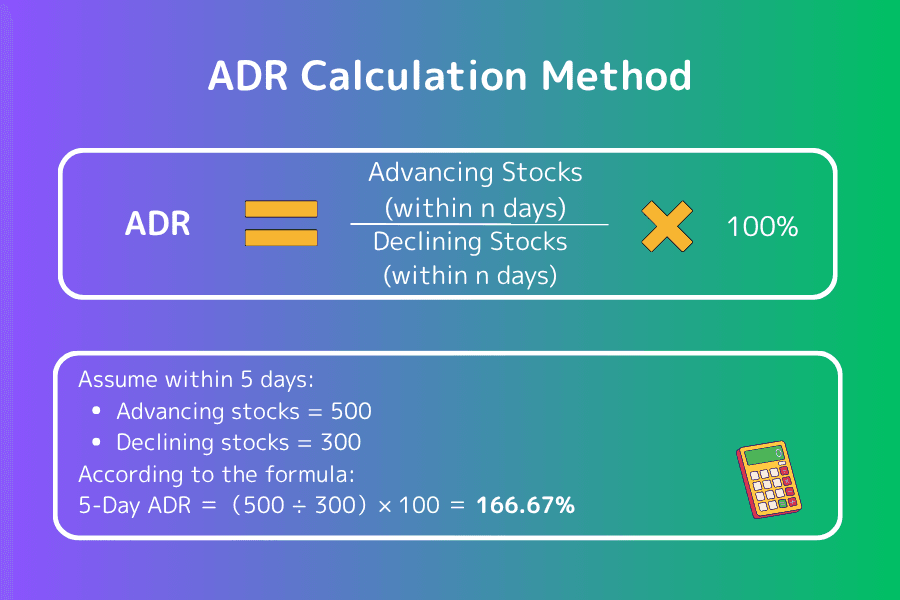
For example: 5-day ADR = (advancing stocks over 5 days ÷ declining stocks over 5 days) × 100
Assume 500 stocks advanced and 300 declined over 5 trading days:
5-day ADR = (500 ÷ 300) × 100 = 166.67%
How to read the result:
When the ADR breaks above 120%, the market is in buy-heavy territory and the odds of a short-term pullback rise.
2. How to Read the ADR
The ADR is best used as a market thermometer — a check on whether sentiment is hot, cold, or balanced. The typical read flow:
Read 1: Above 120% — overheated, watch for pullbacks
The advance count materially exceeds the decline count. Short-term rebounds and consolidations become more likely; new long entries deserve more caution.
Read 2: 80% – 120% — neutral, follow the trend
The ratio is roughly balanced. Sentiment shows no clear directional bias, so combine the ADR with trend indicators (MA, MACD) to read direction.
Read 3: Below 70% — oversold, possible rebound
Decliners dominate the tape. This can set up reversion trades, but check for fundamental triggers (earnings shock, geopolitical risk) before assuming pure mean reversion.
Read 4: Watch for divergences
When the index makes a new high but the ADR slips below 100%, fewer stocks are supporting the rally — an early warning that the up-move is losing breadth and may stall.
3. Common Pitfalls When Using the ADR
Pitfall 1: Stock count ignores move size
The ADR treats every advance and every decline equally. A 0.1% move and a 10% move both count as one stock. That smooths out the data but hides where the real conviction is.
Pitfall 2: Use the ADR with other indicators
The ADR shows market temperature but does not pin down entry levels. Combine it with moving averages (MA), the Relative Strength Index (RSI), and MACD for entry timing.
Pitfall 3: The ADR is for the whole market, not single stocks
The ADR aggregates across the entire stock universe. It is not a signal for the timing of individual positions — using it that way leads to false reads.
4. FX Companion Tool: Titan FX Percentage Change Ranking
The ADR was built for equity markets, but the underlying question — "where is participation strongest right now?" — is just as relevant to FX, commodities, and indices. For that, the Titan FX Percentage Change Ranking tool surfaces today's biggest movers across markets.
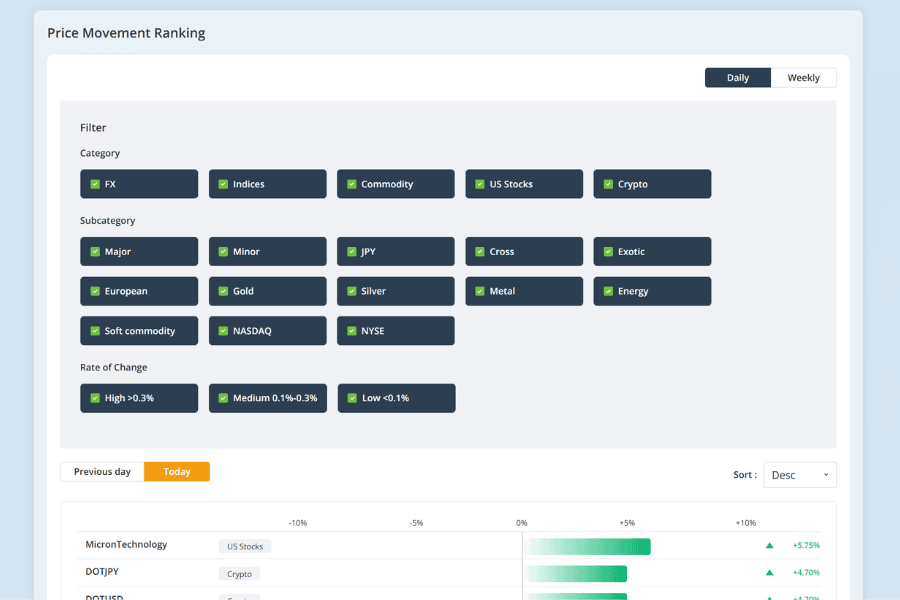
The tool covers Japanese equities, US equities, FX, stock indices, gold, crude oil, and crypto assets in real time.
Data refreshes automatically — no manual collation required. The ranking makes it easy to spot which instruments are leading or lagging on the day, and when paired with the ADR, you can read both equity-market breadth and intraday momentum across asset classes in parallel.
5. ADR vs. Other Market Breadth Indicators
Three indicators commonly get confused. Quick reference:
| Indicator | What it measures | Primary use |
|---|---|---|
| ADR (Advance-Decline Ratio) | Advancing stocks ÷ declining stocks | Gauge market mood, spot overheated or oversold zones |
| OBOS (Over Bought / Over Sold) | Advancing − declining count | Overbought/oversold detection, works well with volume |
| ADL (Advance-Decline Line) | Cumulative (advances − declines) | Track long-term internal buying or selling pressure |
6. Frequently Asked Questions
Q1. Where can I find ADR data?
US data is published directly on NYSE and Nasdaq market activity pages, and most equities-oriented brokers expose it as part of their market breadth dashboards. FX trading platforms like MT4 / MT5 do not show the ADR natively; for cross-asset daily movers, the Titan FX Percentage Change Ranking is the practical alternative.
Q2. What's the difference between the ADR and the Sharpe ratio?
They measure entirely different things. The ADR is a market sentiment indicator based on stock counts, so it shows where breadth lies. The Sharpe ratio is a risk-adjusted return measure for portfolios, calculated as excess return over risk (standard deviation). One reads market temperature, the other compares investment efficiency.
Q3. Is the Advance-Decline Ratio the same as an American Depositary Receipt (ADR)?
They are different concepts that share the same acronym. In this article, ADR refers to the Advance-Decline Ratio — a technical breadth indicator. The American Depositary Receipt is a separate financial product: a US-listed certificate representing foreign-company shares. Always check context before using "ADR" in a statement.
Q4. Can the ADR be used in the FX market?
Strictly speaking, no — the ADR depends on having a large stock universe to compute breadth. FX has too few major pairs to make the math meaningful. The Titan FX Percentage Change Ranking is the practical FX equivalent: it surfaces which pairs are leading or lagging across the trading day.
Q5. Why can't the ADR be used as a standalone entry signal?
The ADR captures the direction of market sentiment but not specific entry levels. Trade decisions still require trend confirmation, support/resistance context, and corroboration from other indicators (MA, RSI, MACD). Using the ADR alone amplifies the risk of mis-timed entries.
7. Conclusion
The Advance-Decline Ratio is a simple but powerful market breadth indicator. Once you internalise the basic thresholds — 120% for overheated, 70% for oversold — it becomes easy to read whether the broader market is in a defensive or expansionary mood, and to avoid being trapped by index-level moves that don't reflect underlying participation.
Combined with conventional technical indicators (MA, RSI, MACD) and the Titan FX Percentage Change Ranking for cross-asset breadth, the ADR fits naturally into a layered trading framework — sentiment first, structure second, and individual setups last.
Further Reading
- Moving Average (MA): how to read and use it
- Relative Strength Index (RSI) basics
- How to use the MACD indicator
- Titan FX Percentage Change Ranking
- What is a stock index?
Titan FX Research and Review Team — covering forex (FX), commodities (oil, precious metals, agricultural products), stock indices, US equities, and crypto assets, producing educational content for retail and institutional investors.
Primary Sources by Category
- Market data and liquidity: NYSE Advance/Decline Statistics, Nasdaq Market Activity (Advancers/Decliners), TradingView "Advance/Decline Ratio (ADR)" official documentation.
- Academic research: Robert D. Edwards & John Magee, "Technical Analysis of Stock Trends" (foundational market-breadth reference); Martin J. Pring, "Technical Analysis Explained" (chapters on A/D Ratio).
- Industry and third-party references: Investopedia (Advance/Decline Ratio, Market Breadth), Fidelity Learning Center (Advance-Decline Indicator), Titan FX Percentage Change Ranking tool.