Washout

A washout is a tactic in which major players deliberately push prices down to shake out nervous retail holders, then accumulate shares cheaply before driving a renewed advance.
In the stock market, a "washout" is a strategy controlled by major players or institutional investors, aiming to lower stock prices in order to absorb more retail investors' shares. This process usually involves price fluctuations that make less confident investors sell their stocks, allowing the major players to acquire shares at a lower price. Once the shares are concentrated, the main players can trigger a new upward trend, making profits.
- A washout is a deliberate price-and-volume operation used by major players to shake out weak retail holders and concentrate shares at low prices.
- Look for consolidation candlestick patterns (triangle, flag, box), shrinking volume, and brief breaches of short-term moving averages followed by quick recoveries.
- The three classic playbooks are pump-and-drop, range consolidation, and limit-down shock — knowing them sharpens identification.
- Distinguish a washout from a true false breakdown by measuring rebound speed and volume structure, not just price action.
- Stay disciplined: avoid panic selling, confirm signals with MA, MACD, RSI, and wait for valid breakouts before acting.
1. Purpose of a Washout
Reduce Floating Shares in the Market
By inducing price fluctuations, retail investors are forced out, selling unstable stocks or futures. This allows the main players to acquire more shares at a lower price.
Impact Market Sentiment
During a washout, the major players will use sharp declines in stock prices to trigger panic among retail investors, forcing them to sell, thereby clearing floating shares.
Eliminate Impatient Investors
Short-term investors or impatient retail investors will sell their stocks during price fluctuations. This allows the main players to remove these unstable investors, preparing for a long-term upward trend.
2. How to Identify a Washout?
During a washout, price fluctuations are typically characterized by consolidation and decreasing trading volume. Here are some common signs of a washout:
Candlestick Patterns
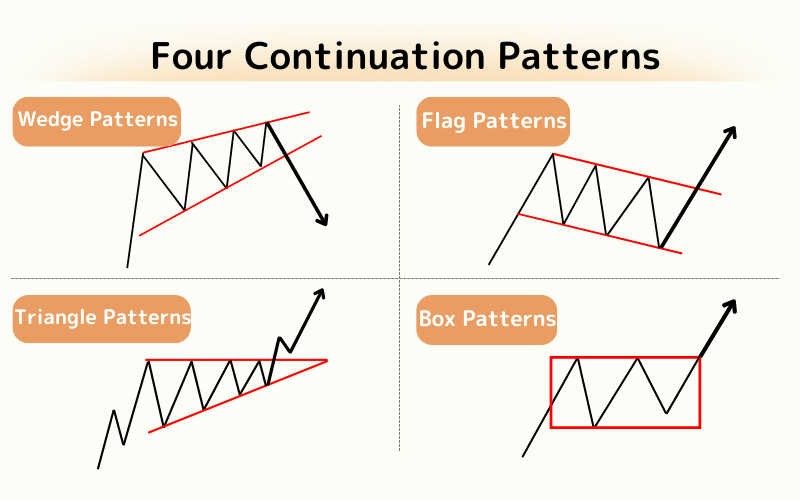
Candlestick charts will show alternating Bullish Candlestick and Bearish Candlestick in a fluctuating range, typically forming triangular, flag, or rectangle consolidation patterns. This indicates the stock is in a consolidation or correction phase.
Changes in Trading Volume
During a washout, trading volume will gradually decrease, indicating that the market is less active. This is a sign that major players are clearing floating shares.
Price Retracement and Moving Averages
The price may temporarily dip below key moving averages but quickly recover, showing signs of a washout. In this process, the stock price may pull back, but the moving averages will still maintain a bullish pattern, signaling that major players are buying shares at lower levels.
3. Features of a Washout
Slow Price Increase and Sudden Drops
The stock price may experience rapid increases followed by sharp drops, indicating market consolidation.
Decreasing Trading Volume
During the washout, the trading volume will shrink as the stock price falls, and when the price rises, volume will gradually increase, indicating major players are absorbing shares.
Short-Term Break Below Moving Averages, Then Quick Recovery
The stock price may briefly fall below key short-term moving averages (e.g., 10-day moving average), but will quickly recover, indicating strong support from the major players.
Increased Concentration of Shares
As retail investors gradually exit, the floating shares in the market decrease, and trading volume becomes smaller. The remaining shares will mostly be held by stable medium-to-long-term investors.
4. Common Washout Methods
High-Low Washout Method
The major players push the stock price to a higher level and then sell off large quantities to create panic, forcing retail investors to sell their stocks. Once the price drops to a low level, the major players buy up more shares, waiting for the next price increase.
Consolidation Washout Method
When the stock price is in a low consolidation phase, major players will use a prolonged range consolidation to allow impatient investors to sell their stocks. During this period, the major players quietly absorb shares from retail investors, reducing floating shares. While this process may take a long time, it allows the major players to collect enough stock during the stable consolidation phase.
Limit Down Washout Method
In this strategy, the major players might force the stock price to hit the limit down, creating extreme panic and forcing retail investors to sell their shares at the limit down price. Afterward, the major players quickly lift their sell orders and absorb these shares, breaking the limit down and starting to push the stock price higher.
5. How to Distinguish a Washout from a False Breakdown?
A washout is a normal market adjustment, while a false breakdown is a market scam. The key to distinguishing between the two lies in whether the stock price can quickly recover. If the price rebounds sharply after breaking a moving average and trading volume gradually increases, it is likely a washout signal by major players. On the other hand, if the price fails to recover and continues to fall, it may be a false breakdown.
6. How to Respond to a Washout?
Stay Patient
Once you identify the signs of a washout, it’s important to remain calm and avoid making hasty decisions due to short-term price fluctuations.
Use Technical Analysis Tools
Using technical indicators (e.g., support levels, resistance levels, volume) can help confirm whether the market is in a washout phase. These tools help investors determine if the current market is in a normal consolidation phase.
Avoid Buying High and Selling Low
During a washout, price fluctuations can lead to market misjudgments. It's best to avoid chasing prices too high or selling too low during periods of intense volatility. Wait for the stock price to stabilize and recover before making moves.
7. Risks and Limitations of Washouts
Although washouts are commonly used by major players as a strategy, they come with certain risks and limitations:
Misjudging the Market
Not every price fluctuation is a washout. Investors may miss out on long-term gains if they misjudge the market. For example, during a washout, a market misreaction may occur, so investors need to be cautious when making judgments.
Emotional Distractions
Retail investors are often influenced by emotions after experiencing repeated price fluctuations, which can lead to poor decisions. This can cause them to miss out on the major players’ price increase opportunities.
Unpredictability of Market Response
The market’s response during a washout is not always as expected. Major players may face larger market volatility risks. External events and market sentiment may alter the washout pattern, increasing uncertainty in the operation.
8. FAQ on Stock Market Washouts
Q1. Does every consolidation pattern mean a washout is underway?
Not necessarily. Sideways action can also stem from market indecision, weak fundamentals, or capital sitting on the sidelines. To confirm a washout, combine moving-average behavior, volume context, and the broader trend.
Q2. Can technical patterns alone identify a washout?
Patterns are tools, not standalone signals. Pair them with the overall market backdrop, sector news flow, and the historical behavior of major players in the stock to judge whether the move is true absorption.
Q3. Do major players combine washouts with news manipulation?
Often, yes. Some operators amplify negative headlines or media narratives in parallel with technical pressure, attacking both the chart and the confidence of retail holders to maximize selling pressure.
Q4. Does a washout always lead to a subsequent rally?
A washout is only one tool in the absorption playbook. Whether the rally materializes depends on capital momentum, sector trend, and overall market sentiment. Watch for a valid breakout backed by improved volume-price structure before assuming continuation.
Q5. Do washouts occur in every type of stock?
Washouts are most visible in small-to-mid-cap, speculative, and operator-heavy names. Large-cap index constituents, with high liquidity and information transparency, are far harder and costlier to wash out.
9. Summary
A washout is the textbook combination of shake-out and absorption that lets major players clear floating supply and seize market initiative — the groundwork for a future advance.
For investors, the crucial skill is telling washouts apart from true breakdowns by combining candlestick structure, moving-average alignment, and volume changes. Pair that with the discipline to ignore short-term panic so the eventual turning point isn't missed.
Ultimately, the blend of rationality and strategy lets you stand firm through the washout, switch from defense to offense, and join the genuine trend when it finally launches.
Further Reading
- Bottom Fishing — Buying the Dip Strategy
- Averaging Down — Lowering Your Cost Basis
- Stop Loss — Cutting Losses Effectively
- 16 Candlestick Patterns Every Trader Should Know
- Wedge, Flag, Triangle, and Box Consolidation Patterns
This article was prepared by the Titan FX Research editorial team, drawing on technical-analysis frameworks for equity markets, observed patterns of major-player accumulation and shake-out, and behavioral analysis grounded in publicly available price and volume data. Our goal is to give readers a stable lens for the washout phenomenon, beyond day-to-day noise.
Primary Sources (by Category)
- Technical Patterns: Consolidation Patterns Explained, 16 Candlestick Patterns
- Trend Indicators: Moving Averages (MA), MACD, RSI
- Related Glossary: Bottom Fishing, Averaging Down, Stop Loss, Divergence