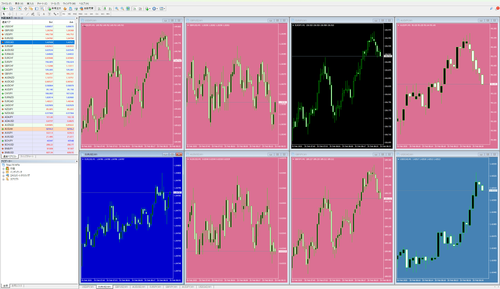
MT4/5 Indicator library
Indicator for Displaying the "Price Condition" of Each Timeframe (Titan_TF_MomentumGraph)
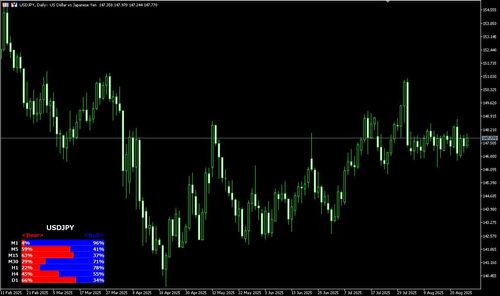 Overlay
This is an indicator that displays the "price condition" of each timeframe.
Highlights the ±2σ to ±3σ range of Bollinger Bands (Titan_Overshoot)
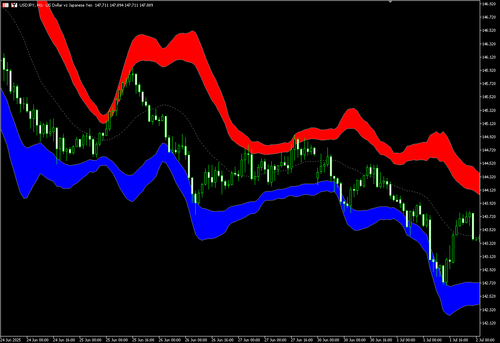 Overlay
This is an indicator that highlights the area between ±2σ and ±3σ of the Bollinger Bands.
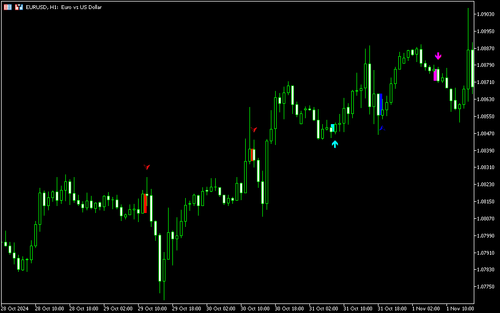
Indicator for detecting the occurrence of pin bars
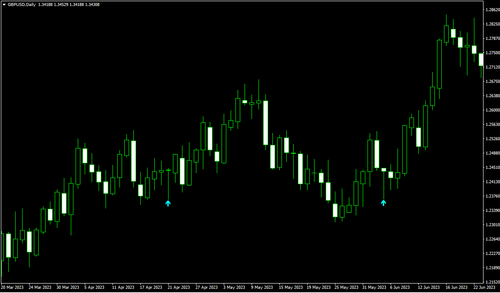 Overlay
This is an indicator that detects the occurrence of Pin Bars.
Indicator for detecting MACD divergence (Titan_MACD_Divergence)
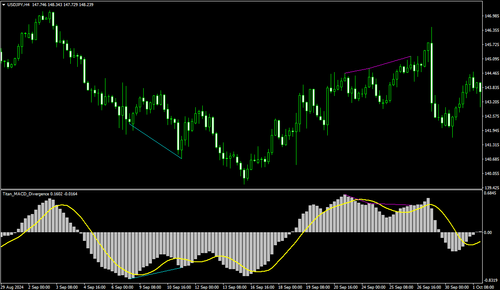 Overlay
This is an indicator that detects MACD divergence.
Indicator based on RSI that notifies potential trend reversals (Titan_RSI_Bands)
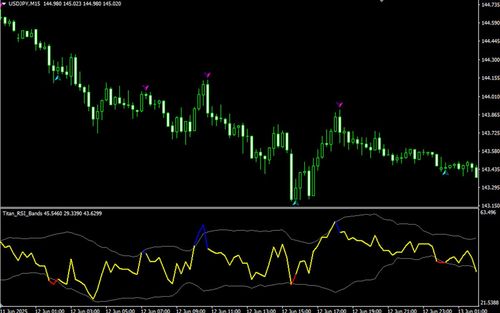 Subchart
This is an indicator that signals potential trend reversals based on the RSI.
Indicator for Switching Chart Timeframes and Symbols via Keyboard (Titan_ChangeSymbolTimeframe)
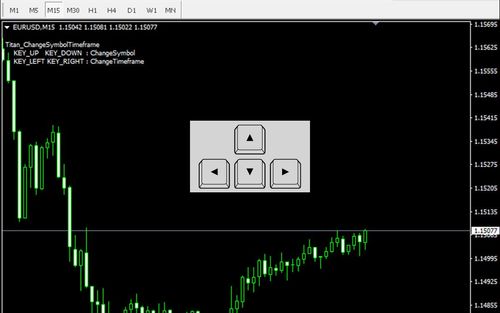 Others
This is an indicator that allows you to switch chart timeframes and symbols using keyboard shortcuts.
Candlestick Color Indicator Based on Trend Direction (Titan_MA_ColorCandle)
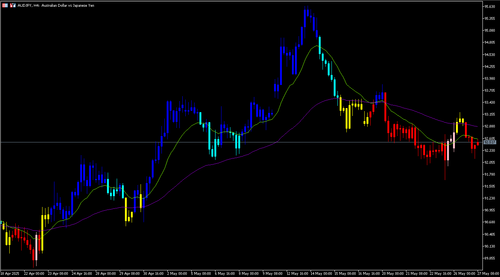 Overlay
An indicator that changes the color of candlesticks based on the trend condition.
An indicator that displays spread and price ticks in a sub-chart. (Titan_TickSpread)
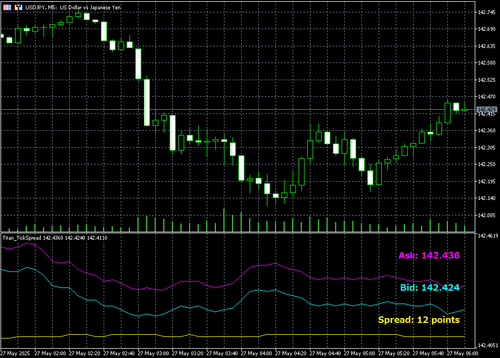 Subchart
An indicator that visualizes spread and price ticks in a subwindow.
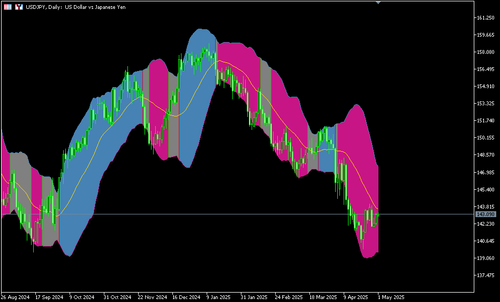
An indicator that changes color based on the state of the Bollinger Bands (Titan_ColorBands)
 Overlay
An indicator that changes the color within the bands based on the state of the Bollinger Bands.
Indicator for Detecting Harami(Inside bar) and Engulfing Patterns (Titan_InsideAndEngulfingPattern)
 Overlay
This is an indicator that detects Harami and Engulfing candlestick patterns.
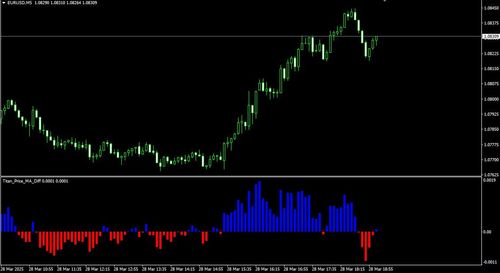
Histogram Indicator Showing the Difference Between Price and Moving Average (Titan_Price_MA_Diff)
 Subchart
This indicator displays the difference between the price and the moving average as a histogram.
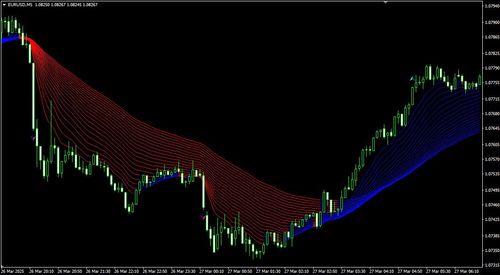
Indicator That Displays 20 Moving Averages (Titan_20MA)
 Overlay
This is an introduction to an indicator that displays 20 moving averages with different periods simultaneously on MT5/MT4 charts.
An indicator that changes the background color based on trend strength. (Titan_DMI_Trend)
 Overlay
An indicator that displays trend strength using background colors.
An indicator that displays trends for each timeframe as a heatmap (Titan_DMI_Monitor).
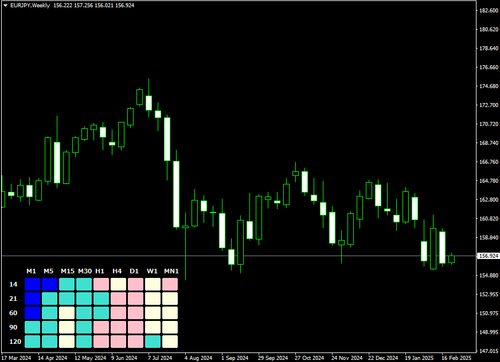 Overlay
Displays the strength of short-term, medium-term, and long-term trends as a heatmap based on the values of +DI and -DI from the DMI.
Indicator that Draws Lines on RSI and Notifies Breakouts (Titan_RSI_Trend)
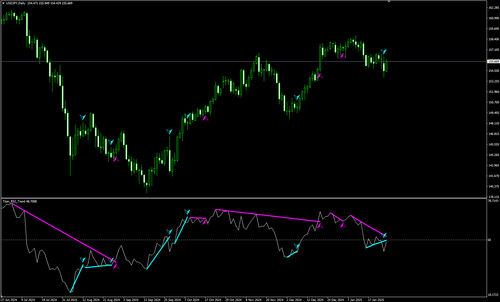 Subchart
This indicator automatically draws trend lines on RSI and notifies you when a line break occurs.
Indicator that Displays CCI as a Histogram (Titan_CCI_ColorHistogram)
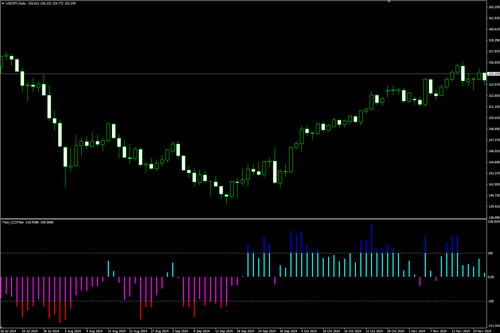 Subchart
An indicator that displays CCI as a histogram, making it easier to visualize.