

What Is VWAP? How to Calculate, Read and Trade the Volume-Weighted Average Price
A regular moving average treats every candle equally, while VWAP gives more weight to candles with more volume. It usually resets at the start of each trading day, so day traders often use it as an intraday dividing line. When price is above VWAP, it is trading above the day's average level, and buyers usually have the upper hand. Below VWAP, sellers usually do.
This guide covers how VWAP is calculated, how it differs from a moving average, three common ways to use it, and the volume problem you need to keep in mind when using VWAP in forex.
- VWAP is a volume-weighted average price that usually resets each trading day and is mainly used for intraday trading
- Price above VWAP leans bullish and price below leans bearish. VWAP also often acts as dynamic intraday support or resistance
- Three common approaches: buy or sell pullbacks to VWAP in the trend's direction, read a cross of VWAP as a shift in strength, and wait for price to revert after stretching far from VWAP
- Forex has no centralized volume data. In MT4 and MT5, forex volume is usually tick volume (the number of price updates), so treat forex VWAP as a reference
- MT5 has no built-in VWAP indicator, so you need to add a custom one
1. What Is VWAP?
The volume-weighted average price (VWAP) is, as the name says, an average price that uses volume as its weight. It answers one question: so far today, at what price has the market traded on average?
Prices where more volume changes hands pull VWAP toward them. Institutions executing large orders often use VWAP as a benchmark for execution quality: if their average buy price is below VWAP, they bought more cheaply than the market average.
For individual traders, VWAP has two main uses:
| Use | What it tells you |
|---|---|
| Gauge the day's bias | Price above VWAP leans bullish; below leans bearish |
| Find intraday reference levels | Price often reacts with support or resistance when it returns to VWAP |
2. How to Calculate VWAP
The common method multiplies each candle's typical price (the average of the high, low, and close) by its volume, adds these up from the start of the trading day, and divides by cumulative volume:
Example: hypothetical figures for the first three candles of a trading day
Candle 1: high 1.1020, low 1.1000, close 1.1010; typical price 1.1010; volume 1,000
Candle 2: high 1.1040, low 1.1020, close 1.1030; typical price 1.1030; volume 3,000
Candle 3: high 1.1030, low 1.1010, close 1.1020; typical price 1.1020; volume 1,000
Calculation: (1.1010 × 1,000 + 1.1030 × 3,000 + 1.1020 × 1,000) ÷ 5,000 = 1.1024
The simple average of the three typical prices is 1.1020, but VWAP is 1.1024. Candle 2 has the most volume, so VWAP is pulled toward its 1.1030.
This is the common approximation based on candle data. A strict VWAP uses the price and size of every individual trade, and indicators differ in the price and volume data they use, so values can vary slightly.
Because the calculation is cumulative, VWAP moves a lot with price early in the trading day. Later in the day, each new candle has less effect, and the line flattens out.
3. VWAP vs. Moving Average
| Aspect | VWAP | Moving average |
|---|---|---|
| Weighting | Weighted by volume | Simple: equal weight per candle; exponential: more weight on recent candles |
| Calculation window | Cumulative from a set starting point, most often reset each day | A fixed number of candles, such as the last 20 |
| Parameters | No period, just a starting point | A period must be set |
| Best timeframes | Mainly intraday minute and hourly charts | Any timeframe |
Put simply, a moving average shows the average of the last N candles, while VWAP shows the market's average trading level since the start of the day.
4. How to Read VWAP
-
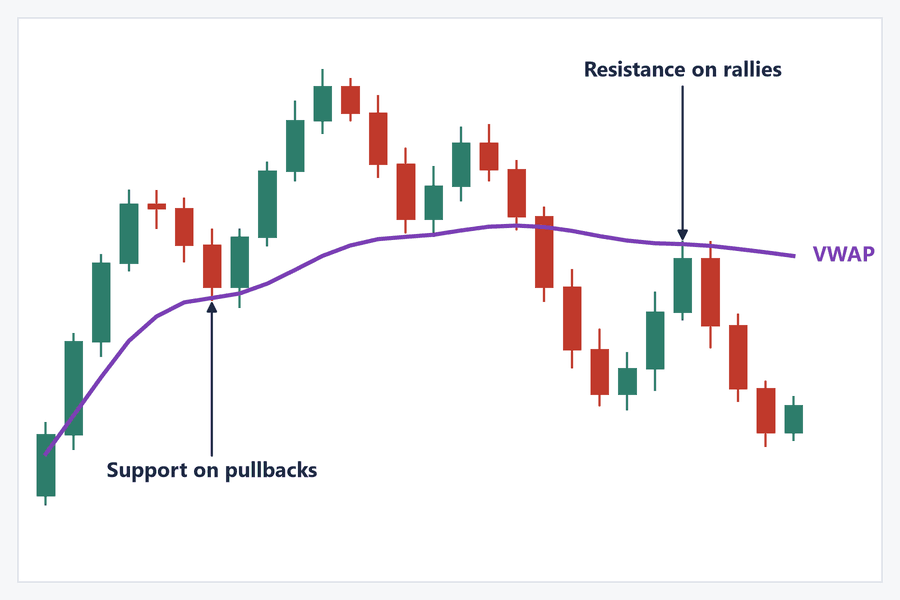
Price above VWAP: price is above the day's average trading level, so intraday momentum is stronger. When price pulls back to VWAP, the line often acts as support
-
Price below VWAP: price is below the day's average trading level, so intraday momentum is weaker. When price rallies to VWAP, the line often acts as resistance
-
Price crossing back and forth: neither side has a clear edge, and using VWAP alone to judge direction tends to mislead
Some VWAP indicators also add standard deviation bands (such as ±1σ and ±2σ) to show how far price is from VWAP. Reaching the ±2σ band means price has stretched well away from the average, but it doesn't guarantee a reversal.
5. VWAP Trading Strategies: Three Common Approaches
-
① Trade pullbacks to VWAP with the trend: when price has been holding above VWAP, wait for a pullback to VWAP that stalls, then buy. When price has been below VWAP, wait for a rally to VWAP that fails, then sell. This is the most common approach
-
② Trade a VWAP cross: a close above VWAP from below suggests the day's balance of strength may be shifting. When price crosses back and forth often, this signal tends to fail
-
③ Trade reversion after an extended move: when price stretches far from VWAP, for example to the ±2σ band, and loses momentum, wait for a move back toward VWAP. This is a counter-trend approach, and in strong trends price can keep riding the outer band
Example: hypothetical figures, trading a pullback to VWAP on the EUR/USD 15-minute chart
Bias: price has spent most of the session above VWAP, so the day leans bullish
Signal: price pulls back to VWAP near 1.0850, makes a pullback low of 1.0845, and stops falling. The next candle breaks above the previous candle's high at 1.0858
Entry: buy at 1.0858
Stop and target: the stop goes below the pullback low at 1.0838, a risk of 20 pips. The target is the day's high at 1.0898, a potential gain of 40 pips, for a risk-reward ratio of about 1:2
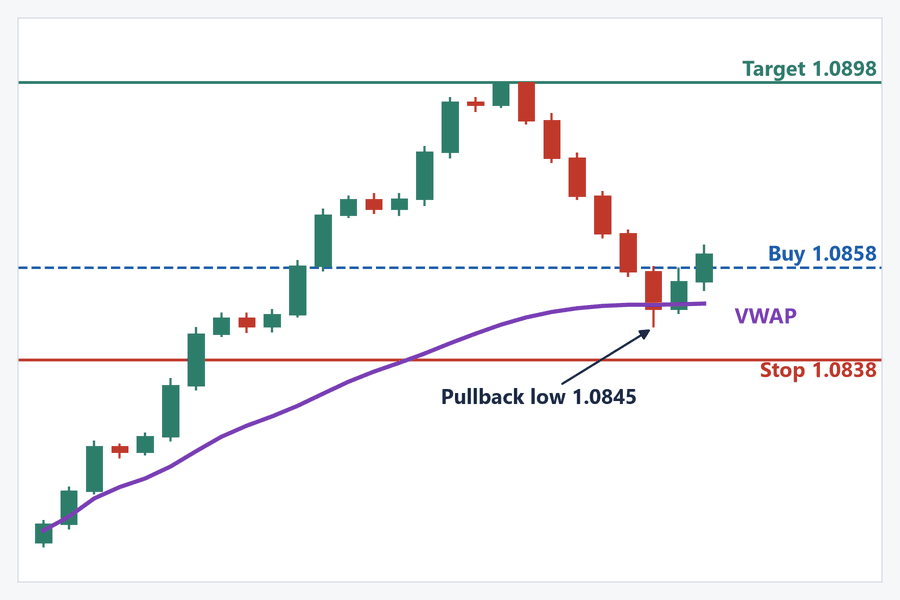
If price closes below VWAP during the pullback and stays there, skip the trade, because the day's balance of strength may have changed.
VWAP moves over time, so base your stop on price structure and volatility, such as the pullback low or the signal candle. It doesn't have to sit just below VWAP. Your actual fill may also differ because of spreads and slippage.
6. What to Watch for When Using VWAP in Forex
Forex has no centralized volume
Stocks trade through exchanges, so every trade's volume is visible. Spot forex trades mainly over the counter between banks and dealers, and there is no single place that records volume for the whole market.
The volume shown on forex charts in MT4 and MT5 is usually tick volume, the number of times price updated during a period. MT5's volume indicator lets you choose tick volume or real volume, but forex symbols usually only provide tick volume.
Tick volume tends to track real volume to some degree, and both rise when the market is busy, but they aren't the same thing. Treat forex VWAP as a reference, and expect values to differ between brokers and platforms.
Check where the calculation starts
The forex market trades almost 24 hours a day and has no single opening time. Some VWAP indicators reset at midnight server time by default, while others let you set a trading session or a custom starting point. Midnight server time may not match your local time or the open of the main markets, so check the starting point before comparing VWAP across platforms.
Best suited to intraday trading
Because VWAP resets each trading day, it suits day trading and scalping. If you hold positions for several days or more, consider a moving average or the anchored VWAP in Section 7.
7. Anchored VWAP
Anchored VWAP starts the calculation from a candle you choose, instead of resetting at midnight each day. Common anchor points include:
-
An important high or low
-
A major release, such as a central bank rate decision or US nonfarm payrolls
-
The candle where price broke through a key level
VWAP anchored to one of these points shows the market's volume-weighted average price since that event. When price returns to the line, it often reacts with support or resistance.
8. How to Add VWAP to MT5, Plus the Market Profile Indicator
MT5's standard indicators don't include VWAP. According to the official help, the built-in volume indicators are Accumulation/Distribution (A/D), Money Flow Index (MFI), On Balance Volume (OBV), and Volumes.
To use VWAP in MT5, search for VWAP in the Code Base of the official MQL5 community. It has several free, open-source VWAP indicators, including daily, weekly, and custom-anchor versions. These are contributed by community users, so read the description before downloading and check whether the indicator uses tick volume or real volume and when it starts calculating.
If you want to see which price levels price passed through most often today, you can add the Titan FX MT4/MT5 indicator Market Profile (Titan_Market_Profile).
On 15-minute, 30-minute, and 1-hour charts, it colors the day into Asia-Oceania, European, and US sessions and shows how many times price passed through each level. A line extending to the left marks the mode, the level price visited most often that day.
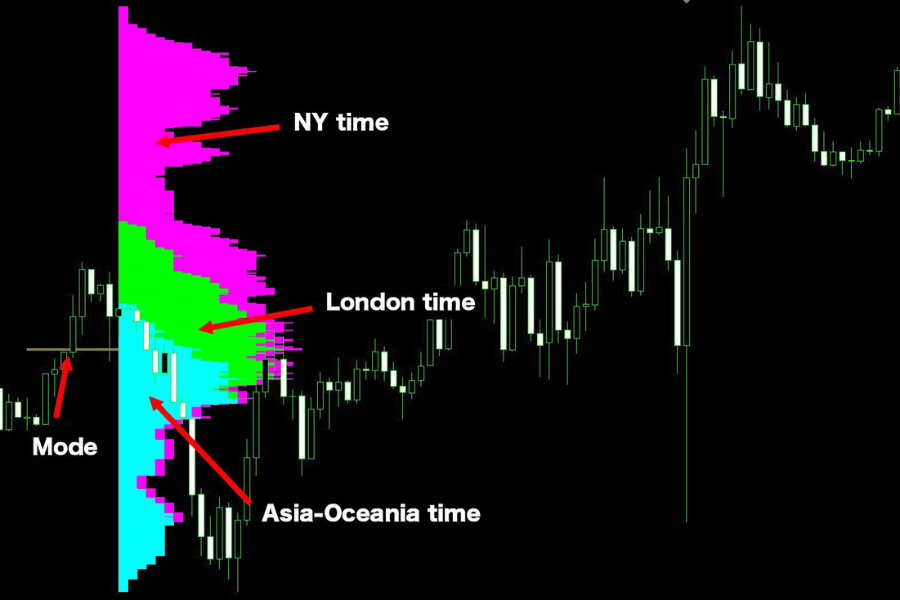
The two tools look at the market from different angles. VWAP is a single average line calculated from volume, while Market Profile counts how often price appeared at each level, not volume. The level with the highest count on the previous day often acts as support or resistance later on.
This indicator works only on the Windows versions of Titan FX MT5 and MT4.
View Market Profile9. FAQ
Q1. Which timeframe works best with VWAP?
It's mainly used on intraday charts from 1 minute to 1 hour. On daily charts and above, each candle is a whole day, so a VWAP that resets daily has no meaning. To see the average level over several days or weeks, use a weekly VWAP or an anchored VWAP.
Q2. Does VWAP need any settings?
VWAP has no period setting. You only decide when the calculation starts and which price it uses. Most indicators default to the typical price, and some let you switch to the close.
Q3. Can VWAP tell you when a market is overbought or oversold?
Not on its own. The farther price is from VWAP, the larger the gap from the average, but that doesn't mean a reversal is coming. Indicators with standard deviation bands can help measure how stretched price is, but you still need to consider the trend and price structure.
Q4. What's the difference between VWAP and TWAP?
TWAP (time-weighted average price) gives every time period equal weight and ignores volume. Both are often used by institutions to split large orders: VWAP places more of the order during high-volume periods, while TWAP spreads it evenly over time.
10. Conclusion
VWAP is the day's volume-weighted average price. Price above it leans bullish, price below it leans bearish, and price often finds support or resistance when it returns to the line. The most common approach is to wait for a pullback to VWAP in the direction of the trend before entering.
Forex has no centralized volume, so VWAP is calculated from tick volume, and its starting point varies by platform. Use it as an intraday reference line, together with price structure and a stop loss.
Further Reading
Titan FX Research Team. We cover a broad set of financial instruments — foreign exchange, commodities (crude oil, precious metals, agricultural products), equity indices, US equities, and digital assets — producing practical, research-backed educational content for traders.
Primary Sources (by Category)
- Platform documentation: MetaTrader 5 Help, "Volume Indicators" and "Volumes" (built-in volume indicators; tick volume and real volume); VWAP indicator pages in the MQL5 Code Base
- Titan FX tools: Titan_Market_Profile indicator page (accessed November 9, 2026)
- Technical analysis methods: VWAP and anchored VWAP calculations are standard methods in technical analysis and trade execution