Line Chart
In technical analysis, the chart is the primary window into price behavior and market sentiment.
Among the various chart formats, the line chart stands out for its simple structure and clear trend signal, making it a core tool used by beginners and professional analysts alike.
A line chart focuses on the continuous movement of the closing price, helping traders read the market's direction and key turning points cleanly.
This article walks through the line chart's basic principles, how it differs from other charts, practical application techniques, and how to display and configure it on MT4 and MT5.
- Definition: closing prices connected into one line — the simplest price chart
- Vs candlestick/bar: line shows the close only; the others add OHLC detail
- Four uses: trend tracking, support/resistance, indicator pairing, multi-timeframe
- Platform setup: one click on MT4/MT5, shortcut Alt + 3
- Its role: the first chart pros open to read the big picture
1. What Is a Line Chart? Structure and Characteristics
A line chart is one of the most basic price-chart formats. It takes the closing price (Closing Price) of each time interval and connects every close with a line to form a continuous price-trend line.
In forex, index, and equity markets, the line chart is mainly used to observe the overall trend direction and major support/resistance zones, making it well suited to long-term trend analysis and strategy review.
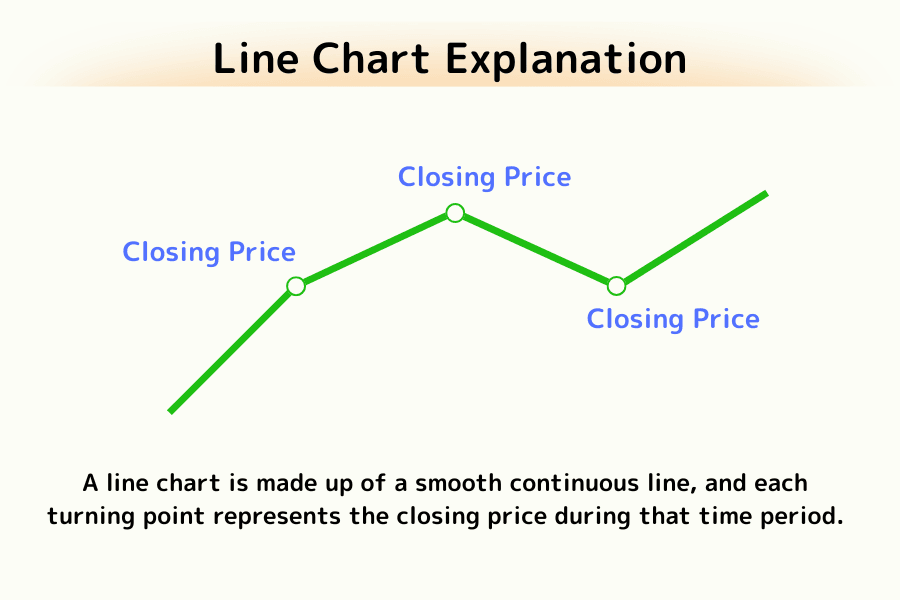
Structure
A line chart is a single smooth continuous line; each vertex represents the close of that period.
| Item | Description |
|---|---|
| Closing price | The price data source for each point |
| Connection | Adjacent closes joined by a line |
Because a line chart does not show the open, high, or low, it carries less information but a clearer trend, which makes it ideal for beginners to read market direction quickly.
2. Line Chart vs Candlestick and Bar Charts
The line chart, the candlestick chart and the bar chart are the three most common price-chart formats in technical analysis.
Their differences mainly show up in information richness and visual structure. Understanding them helps you pick the right tool for the analytical task.
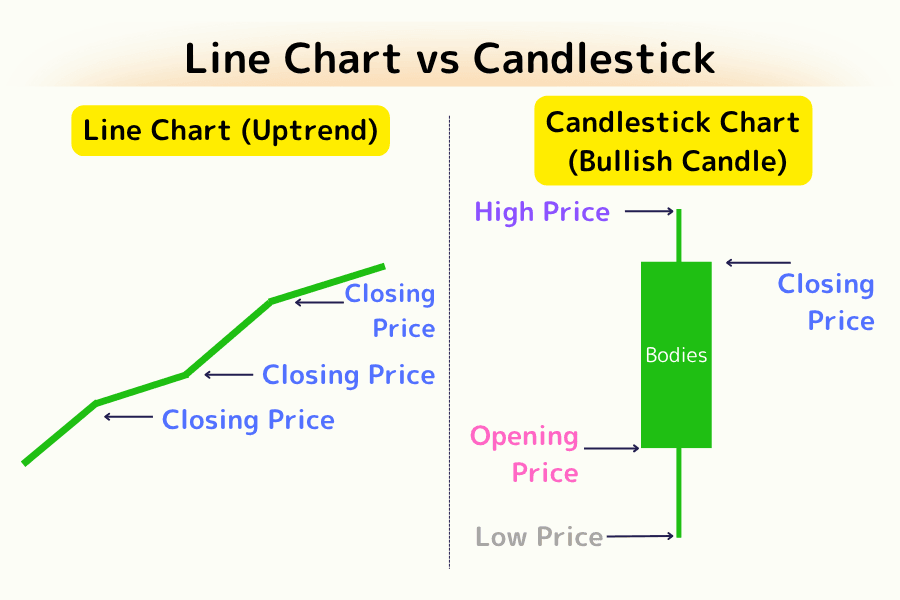
Comparison 1: Line Chart vs Candlestick
A line chart shows only the connected closes, whereas a candlestick shows the open, close, high, and low at once, using the body and color to mark gains and losses.
This lets the candlestick clearly express the sentiment shift and momentum of a single bar, while the line chart is better for observing changes in the overall trend direction.
| Item | Line Chart | Candlestick Chart |
|---|---|---|
| Shows | Close only | Open, close, high, low |
| Structural complexity | Very simple | Wicks and bodies, information-rich |
| Visual effect | Smooth and clear | Color-coded moves, high readability |
| Trend reading | Emphasizes overall trend | Also shows short-term reversal signals |
| Best for | Beginners, long-term investors | Pros, short-term traders |
| Analytical focus | Long-term direction, S/R | Price structure, reversal patterns |
Comparison 2: Line Chart vs Bar Chart
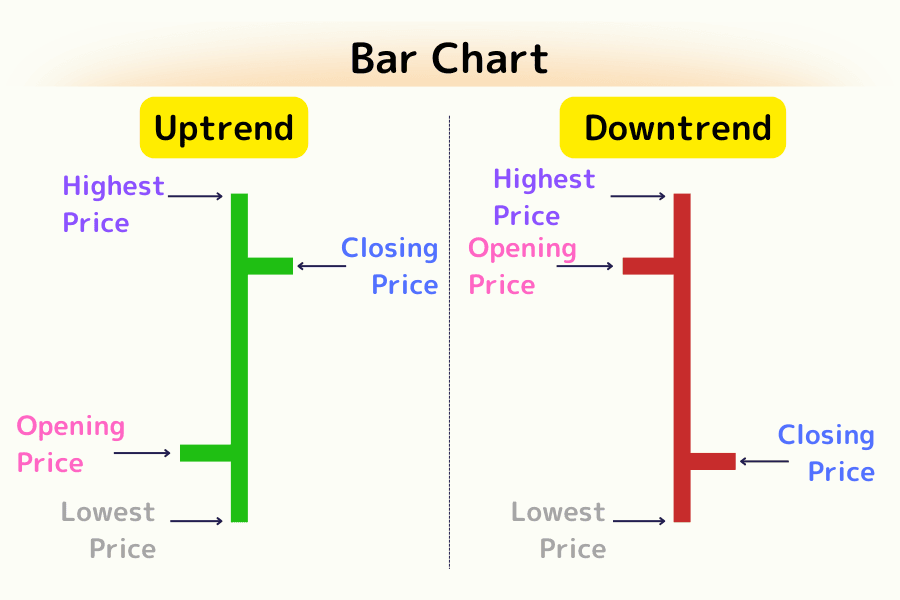
Compared with a line chart, a bar chart provides more complete price-structure information.
A line chart shows only the "close," while a bar chart marks the four prices — "open, close, high, low" — revealing the volatility range and price strength.
Where candlesticks emphasize visual formation, the bar chart emphasizes the logic of the price structure itself.
| Item | Line Chart | Bar Chart |
|---|---|---|
| Price points | Close only | Open, close, high, low |
| Volatility range | Cannot show | Clearly shown |
| Information density | Low | High |
| Trend readability | High | High |
| Move interpretation | Weak (direction only) | Strong (momentum readable) |
| Best for | Long-term trend analysis, review | Short/mid-term price reads, execution |
The bar chart fills in the price-movement detail the line chart lacks, so in practice they are often combined: use the line chart to read direction first, then the bar chart to confirm structure and the strength of the move.
3. Line Chart Application Techniques in Technical Analysis
Although a line chart simplifies information, it remains highly valuable for macro trend analysis, strategy design, and reading trading rhythm.
Its clean line filters short-term noise so you can focus on the core of price movement. Here are four typical applications.
Use 1: Trend Tracking and Reversal Confirmation
The most intuitive use of a line chart is identifying the market's main direction and trend turning points.
- ▸Line keeps rising → an uptrend
- ▸Line keeps falling → a downtrend
- ▸Line moves sideways → a range
When the structure of highs and lows starts to change (for example, a "higher low" or a "lower high" appears), it usually signals that momentum is turning — a key cue for entry and exit timing.
Use 2: Drawing Support and Resistance
A line chart is effective for identifying support and resistance.
Because it is based on the close, it highlights the market's "true consensus zone" at the close.
- ▸If the close repeatedly bounces near a similar price → that area may form support
- ▸If the close repeatedly fails to break a high → that area may form resistance
These key areas can serve as the basis for setting stop-loss and take-profit levels.
Use 3: Pairing With Technical Indicators
Because a line chart shows only the close and the line is smooth and less disturbed by short-term swings, it pairs well with trend and momentum indicators to improve precision and decision efficiency.
- ▸Bollinger Bands: watch whether price breaks the upper/lower band to identify volatility expansion or contraction
- ▸Stochastic Oscillator: combine with the line to judge overbought/oversold zones and confirm short-term reversal odds
- ▸Ichimoku Cloud: overlaid on the line, it captures support/resistance and mid-term trend change together
- ▸CCI (Commodity Channel Index): good for spotting when price deviates from its average range, aiding short-term entries
- ▸Moving Average: a closing-price-based trend line; like the line chart it focuses on the close and smooths direction.
- ▸MACD: pair it with the line chart to watch trend turns and momentum divergence.
Pairing the line chart with these indicators balances "visual simplicity" with "analytical depth," letting you catch key trend and momentum shifts without being misled by noise.
Use 4: Multi-Timeframe Analysis
By observing line charts across different timeframes, you can grasp the long-term trend direction and the short-term price rhythm at the same time. For example:
- ▸Confirm the long-term direction on the weekly chart
- ▸Look for secondary pullbacks on the daily chart
- ▸Catch entry timing on the 4-hour or 1-hour chart
This Multi-Timeframe Analysis makes a strategy more three-dimensional and helps balance risk and reward.
Titan FX offers free custom indicators such as multi-timeframe moving averages (Titan_Multi_MA), Bollinger band width (Titan_BB_width), and multi-timeframe MACD (Titan_Multi_MACD), helping traders analyze momentum flexibly across periods and complement the line chart's trend judgment and strategy use.
4. How to Set a Line Chart on MT4 and MT5
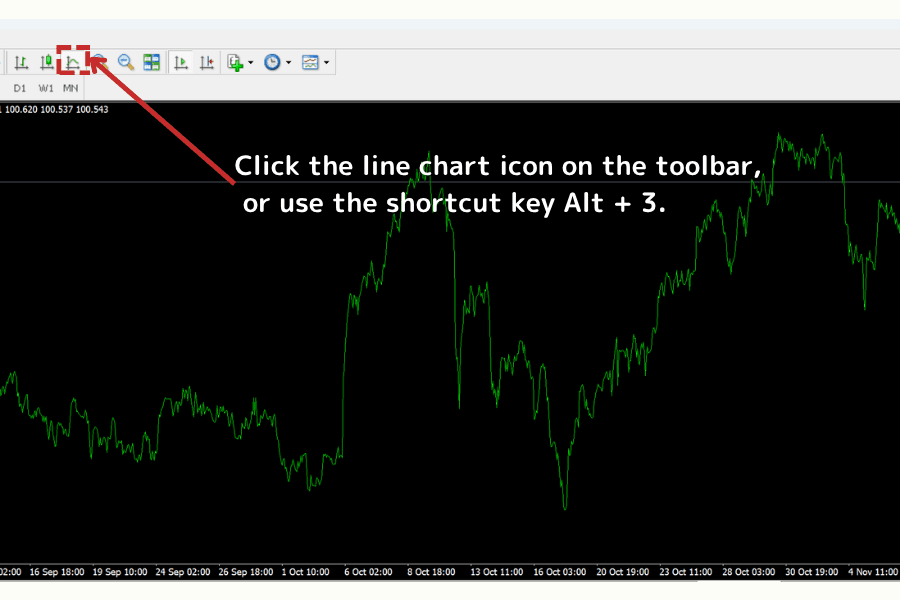
Setting a line chart on MT4 (MetaTrader 4)
- (1) Click the "Line Chart" icon on the top toolbar
- (2) Or choose "Charts" -> "Line Chart" from the menu
- (3) The shortcut is Alt + 3
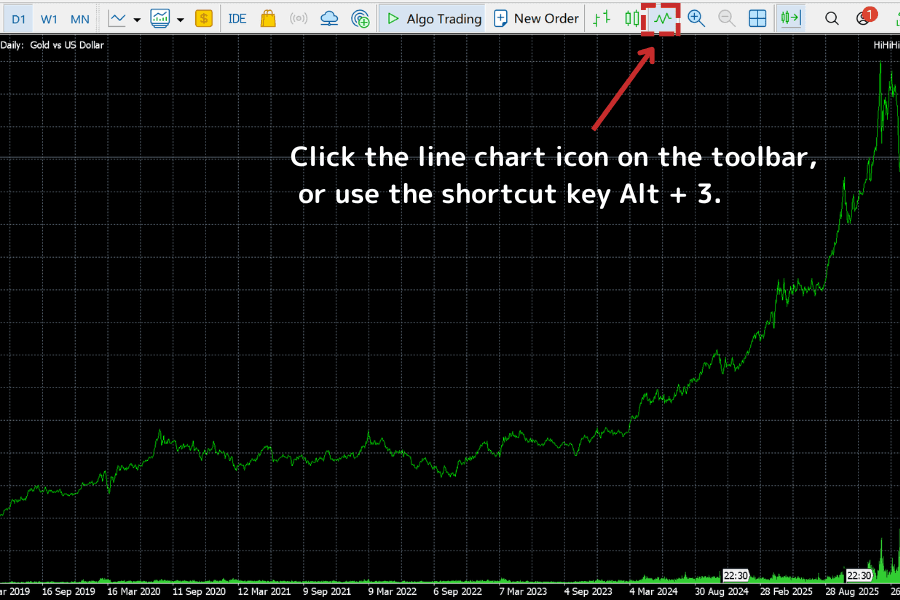
Setting a line chart on MT5 (MetaTrader 5)
- (1) Click the "Line Chart" icon on the top toolbar
- (2) Choose "Charts" -> "Line Chart" from the menu
- (3) The shortcut is also Alt + 3
5. Line Chart FAQ
Q1. Who is a line chart best suited for?
Long-term investors and beginners. It conveys the market's overall direction at a glance and helps build a macro analytical perspective.
Q2. Why does a line chart only show the closing price?
The close is widely treated as the market's final consensus for a period. Connecting closes filters out noise and keeps the focus on the primary trend direction.
Q3. Can a line chart be used for short-term trading?
Yes, but not on its own. Short-term trading needs richer price-movement detail, so pair the line chart with a bar or candlestick chart to fill in the gaps.
Q4. What are the limitations of a line chart?
Its simple structure cannot show the open, high, or low. When you need to judge entries, stop placement, or risk range, combine it with other chart types.
6. The Value of the Line Chart: From Beginner Tool to Professional Baseline
The line chart is not only the starting point of technical analysis but also a foundation for understanding market structure.
It presents the essence of price movement in the simplest way, letting traders focus on what truly matters — trend direction and market rhythm.
Modern traders often use candlesticks or multi-dimensional charts for strategy decisions, yet the line chart has irreplaceable strengths:
- ▸It clears market noise and focuses on core price change
- ▸In multi-timeframe analysis it quickly reveals the primary trend
- ▸Paired with indicators, it serves as the visual baseline for every strategy
In a professional setting, the line chart is often the first chart view opened to judge the market's big picture, providing the framework for later structural analysis (candlestick patterns, support/resistance, breakout strategies).
The value of the line chart lies not only in simplicity but in bringing the analyst back to price itself. Whether you are a beginner or a professional, the line chart is a key starting point for understanding market rhythm and building a strategy.
Further Reading
- What Is a Candlestick Chart?
- What Is a Bar Chart?
- Bollinger Bands
- Stochastic Oscillator
- Ichimoku Cloud
- What Is Technical Analysis?
Titan FX's financial market research and analysis team produces investor education content across a wide range of financial instruments, including foreign exchange (FX), commodities (crude oil, precious metals, and agricultural products), stock indices, U.S. equities, and crypto assets.
Primary Sources by Category
- Chart types and technical-analysis foundations: Investopedia (Line Chart / Technical Analysis); Murphy, J. Technical Analysis of the Financial Markets
- Platform operation: MetaTrader 4 / MetaTrader 5 official user guides (MetaQuotes Software)
- Market application and education: CME Group Education (Chart Types); CMT Association technical-analysis curriculum