

What Is Heikin-Ashi? Formula, Color Signals, and Riding the Trend
Heikin-Ashi is a candlestick chart redrawn from averaged prices: each bar's close is the average of the period's open, high, low, and close, while its open is the midpoint of the previous Heikin-Ashi bar's body — producing a much smoother picture in which trending stretches stay one color. The name is Japanese for "average bar," and the technique belongs to Japan's charting tradition. It adds no new information; it simply redraws the same price data in a way that trades detail for clarity of direction.
Standard candlesticks record every period's open, high, low, and close faithfully — noise included. Anyone who has watched a healthy uptrend print a few counter-trend red candles knows the doubt they plant. Heikin-Ashi averages those bumps away: uptrends print as near-unbroken runs of bullish bars, downtrends as runs of bearish ones, and "is the trend still on?" becomes a question you can answer at a glance. That is why the tool shines brightest in trend-following position management — once in a trade, the color gives you something objective to hold on to.
This article covers the Heikin-Ashi formula with a worked example, how to read the colors, bodies, and shadows, the practical playbook for riding trends, the caveats, and how to display Heikin-Ashi in MT4/MT5 along with Titan FX's two dedicated indicators.
- Heikin-Ashi redraws candles from averaged prices: close = the average of the period's four prices, open = the midpoint of the previous Heikin-Ashi bar's body. The result is a smoother chart.
- Its main value is trend visibility: unbroken same-color runs signal continuation, widening bodies signal strengthening momentum, and a color flip is a candidate exit signal.
- Because each open sits at the midpoint of the previous body, bars connect to each other and gaps almost never appear on the chart.
- The open and close are recomputed values, not traded prices — place orders, stops, and targets using the platform's real quotes.
- Smoothness costs lag: signals arrive later than on standard candles, so precise entries still come from standard charts or other tools.
- MT4/MT5 ship with Heikin-Ashi built in (in the Custom folder, listed as Heiken_Ashi); Titan FX adds a multi-timeframe status panel and a Smoothed version as dedicated indicators.
- 1. What Is Heikin-Ashi?
- 2. How to Calculate Heikin-Ashi: Formula and a Worked Example
- 3. How to Read Heikin-Ashi: Colors, Bodies, and Shadows
- 4. How to Use Heikin-Ashi: Riding Trends and Timing Exits
- 5. Caveats When Using Heikin-Ashi
- 6. Setting Up and Displaying Heikin-Ashi in MT4/MT5
- 7. Heikin-Ashi FAQ
- 8. Conclusion
1. What Is Heikin-Ashi?
Heikin-Ashi is a candlestick chart rebuilt from averages. It uses exactly the same price data as standard candlesticks; only the drawing rules differ. A standard candle shows the period's actual open, high, low, and close. A Heikin-Ashi bar averages them first — the close becomes the mean of the period's four prices, and the open becomes the midpoint of the previous Heikin-Ashi bar's open and close.
That small change transforms the chart's character. Averaging absorbs single-bar shocks, so the stray bearish candles that pepper a normal uptrend mostly disappear: rising stretches print as consecutive bullish bars, falling stretches as consecutive bearish ones, and the trend reads as if run through with a highlighter. The trade-off is that each period's true open and close vanish from the chart, replaced by computed averages.
The division of labor follows naturally: standard candles keep the full price detail and suit structure reading and entry planning; Heikin-Ashi gives up detail for smoothness, making trend continuation and exhaustion far easier to see. Same data — the two charts just choose different things to make obvious.
2. How to Calculate Heikin-Ashi: Formula and a Worked Example
The four Heikin-Ashi prices come from the formulas below, where O, H, L, and C are the period's actual open, high, low, and close:
- ① Heikin-Ashi close = (O + H + L + C) ÷ 4
- ② Heikin-Ashi open = (previous HA open + previous HA close) ÷ 2
- ③ Heikin-Ashi high = the maximum of the actual high, the HA open, and the HA close
- ④ Heikin-Ashi low = the minimum of the actual low, the HA open, and the HA close
Let's run one set of numbers. Suppose the previous Heikin-Ashi bar printed open = 1.1000 and close = 1.1010, and the current EUR/USD period's actual prices are O = 1.1010, H = 1.1030, L = 1.1000, C = 1.1020:
| Price | Substitution | Result |
|---|---|---|
| HA close | (1.1010 + 1.1030 + 1.1000 + 1.1020) ÷ 4 | 1.1015 |
| HA open | (1.1000 + 1.1010) ÷ 2 | 1.1005 |
| HA high | max(1.1030, 1.1005, 1.1015) | 1.1030 |
| HA low | min(1.1000, 1.1005, 1.1015) | 1.1000 |
This bar is bullish (close 1.1015 above open 1.1005), with a longer upper shadow and a short lower one. The first bar on a chart has no previous values, so calculation usually starts from (O + C) ÷ 2 of that period as the open; implementations differ slightly between platforms, and the values converge after a few bars.
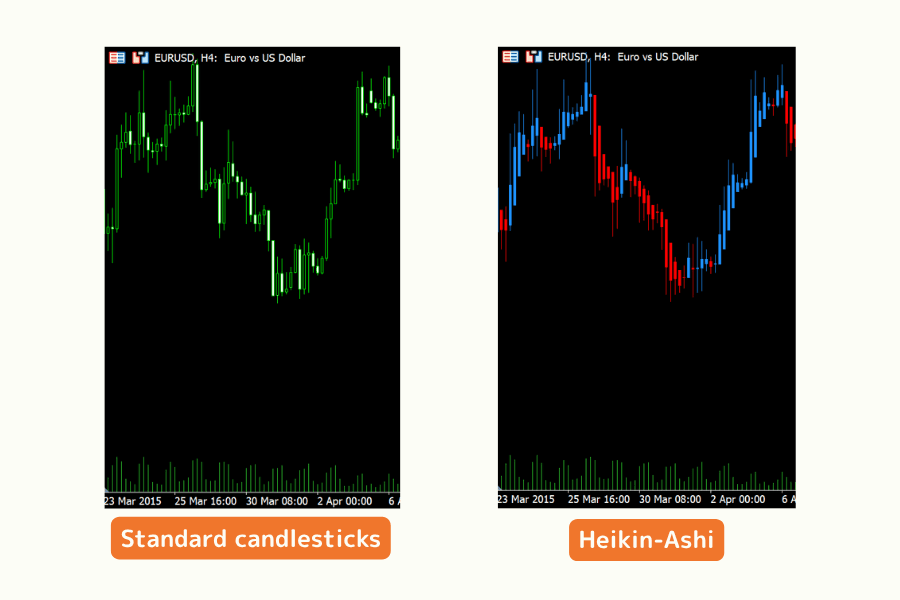
Two intuitions fall out of the formulas. First, since every open sits at the midpoint of the previous body, each bar grows out of the previous bar's "torso" — bars connect, and gaps almost never appear on the chart. Real market gaps still happen; they are simply absorbed into the bar's body and shadow lengths. Second, the high and low still take the actual extremes, so the shadows preserve how far price stretched — and which side they appear on tells you where the pressure is.
3. How to Read Heikin-Ashi: Colors, Bodies, and Shadows
Unbroken same-color runs: the trend made visible
Color is the most intuitive read. In an uptrend, averaging leaves the chart printing bullish bar after bullish bar; in a downtrend, bearish after bearish. The routine pullbacks that appear as scattered red candles on a standard chart are mostly absorbed — which makes "is the color still running?" the first-pass answer to whether the trend is intact.
Body size: momentum's strength
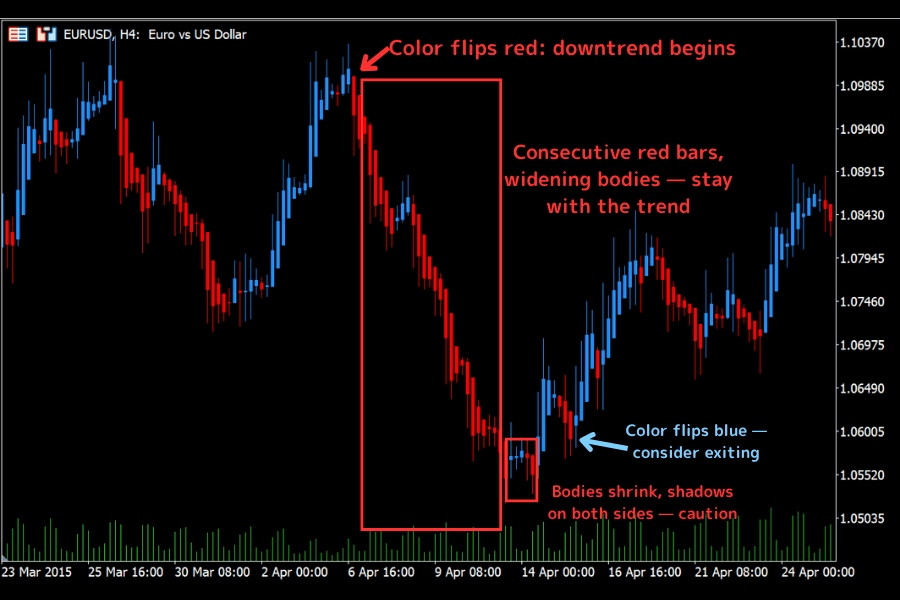
A longer body means the averaged move in one direction was more pronounced, generally read as stronger momentum; bodies expanding bar after bar within a trend usually mark acceleration. Shrinking bodies mean the push is fading — the trend may be pausing or may be near its end, and neither can be settled at that moment. Raise your guard; don't rush to fade the move.
Missing shadows and small bodies: strength, and candidates for a turn
Strong stretches leave a distinctive footprint: shadows appear only on the trend side. In a powerful advance the bullish bars show almost no lower shadows; in a steep decline the bearish bars show almost no upper shadows. When counter-trend shadows start appearing, or bodies shrink into small two-shadow spinning tops, buying and selling pressure is reaching a standoff — a candidate signal for a turn that still needs a color flip to confirm. On its own it is not a reason to act.
4. How to Use Heikin-Ashi: Riding Trends and Timing Exits
Holding the trend trade: stay in while the color holds
Heikin-Ashi's best use case is position management in trend following. The hardest part of a trend trade is staying in it — on a standard chart, every counter-trend candle whispers that it's time to take profits early. Switch to Heikin-Ashi and the rule simplifies: hold while the trend color remains unbroken, and only when the color flips — or bodies shrink markedly and small two-shadow bars stack up — consider scaling down or exiting. This read never sells the exact top; what it buys you is the bulk of the trend.
Entries and risk: execute on real prices
Heikin-Ashi's job is judging the state of play; execution belongs to real prices. Set entries, stop-losses, and targets from the standard chart and the platform's actual quotes: the Heikin-Ashi close is a computed value that may never have traded, so a stop anchored to a Heikin-Ashi level will trigger somewhere other than where you think. The standard setup is two charts side by side — Heikin-Ashi for direction, standard candles for structure and execution.
Multi-timeframe alignment: higher frame for direction, lower for timing
The bullish/bearish state of Heikin-Ashi also lends itself to cross-timeframe checks: let a higher timeframe's color (daily, H4) set the direction, then look for entries along that direction on a lower one. When several timeframes share the same color, the trend agrees across time scales — one more confirmation for a with-trend entry. When the colors disagree, direction is unresolved; waiting is a position too. Titan FX's multi-timeframe status panel turns this check into a single glance (see Section 6).
5. Caveats When Using Heikin-Ashi
① Never treat the displayed prices as traded prices. This is the single most important caveat: the open and close are formula outputs, and the market may never have traded at them. The high and low usually take real extremes, but the bar as a whole is a reconstruction. Order triggers, stops, and targets belong on the platform's real quotes and the standard chart's structure; orders parked at Heikin-Ashi levels will fill away from expectations.
② Smoothness is paid for with lag. Averaging absorbs noise — and absorbs the newest information along with it. A color flip always arrives a beat behind the actual turn. Use Heikin-Ashi as a confirmation tool: it answers whether the trend is still alive, and it is the wrong tool for nailing precise reversal points.
③ It dulls in ranges. In directionless markets the color flips back and forth and small two-shadow bars stack in rows; "color reversal" carries no trend meaning there. Judge trend-versus-range with other tools as well, and once a range is confirmed, cut the weight you give Heikin-Ashi.
④ Gap information is erased. Anchoring each open to the previous body's midpoint means real market gaps never show up as gaps on a Heikin-Ashi chart. Traders who trade gaps and opening behavior need the standard chart for that information.
6. Setting Up and Displaying Heikin-Ashi in MT4/MT5
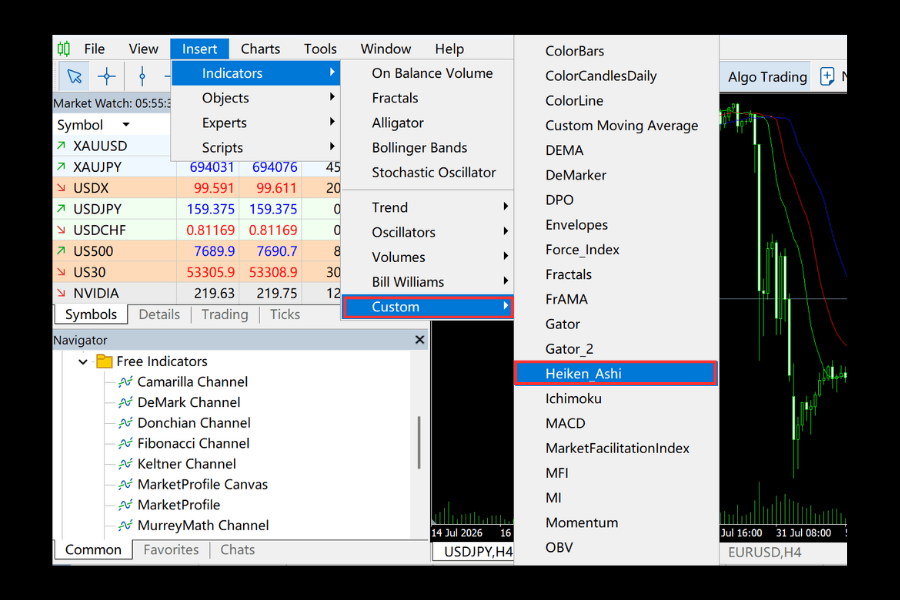
Heikin-Ashi ships built into MT4/MT5: in MT5, load it via "Insert" → "Indicators" → "Custom" → "Heiken_Ashi". MT4 carries the same indicator in the Custom category under "Insert" → "Indicators". One small note: MetaQuotes spells Heikin as "Heiken", and the list shows it as Heiken_Ashi — same indicator. Once loaded, the Heikin-Ashi bars draw on top of the original candles, so the usual practice is to switch the original chart to a line chart or fade its colors so the two layers don't interfere.
To take Heikin-Ashi further, Titan FX provides two dedicated indicators, both for Titan FX's Windows MT4/MT5.
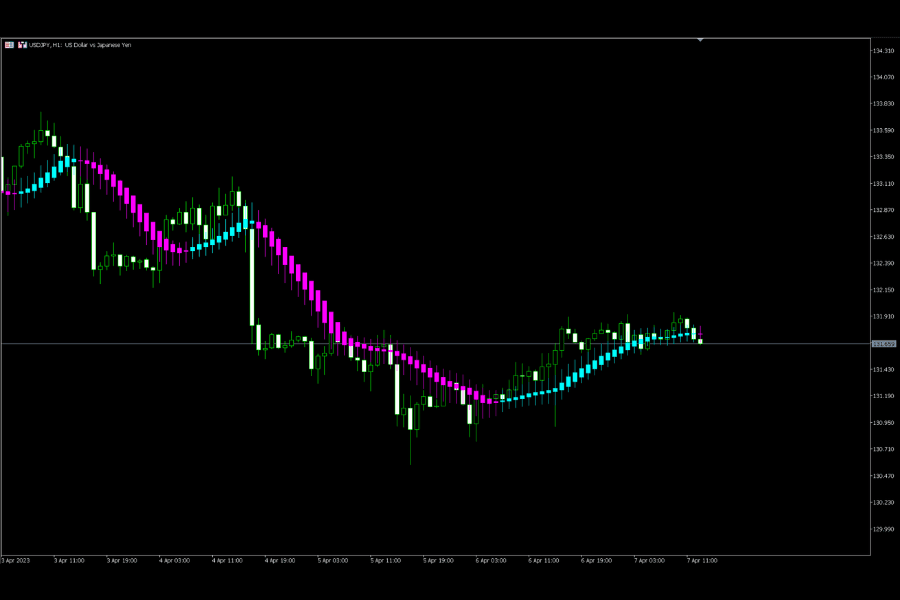
Heikin-Ashi Smoothed: smooths price once with a moving average before computing the Heikin-Ashi bars, and adds a built-in filter that suppresses the frequent recoloring and false breakout-style noise caused by small fluctuations. The cost is slower reaction — the official page notes it is not suited to catching a move's first leg — making it a fit for stability-first trend confirmation.
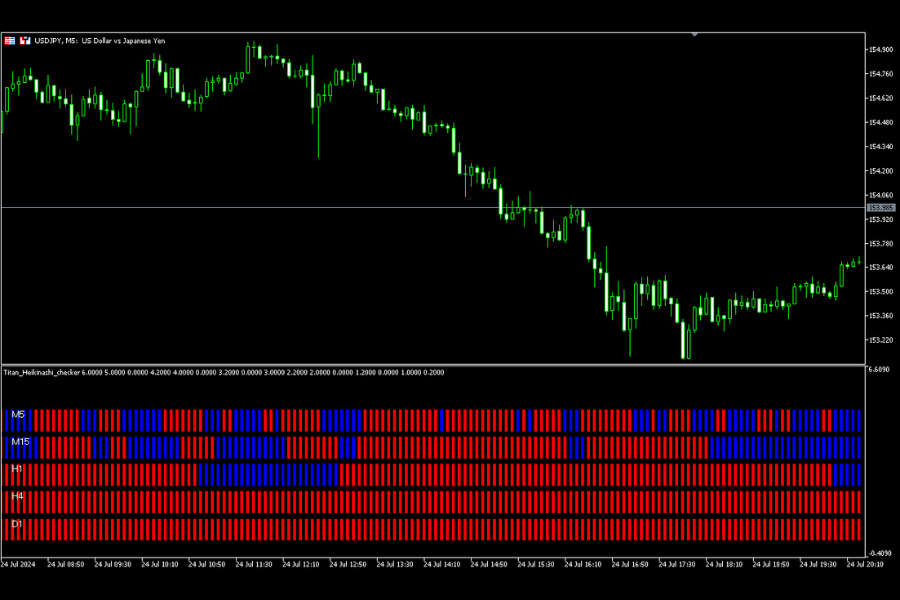
Multi-timeframe status panel (Titan_Heikinashi_checker): displays the bullish/bearish Heikin-Ashi state of up to five timeframes at once (Current, 15 minutes, 1 hour, 4 hours, and daily by default). When short and long timeframes agree, direction is comparatively clear; when the panel is mixed, direction is unresolved — Section 4's multi-timeframe check, reduced to one look.
7. Heikin-Ashi FAQ
Q1: How is Heikin-Ashi different from standard candlesticks?
Same data, different drawing rules. Standard candles record each period's actual open, high, low, and close; Heikin-Ashi averages the four prices into the close and anchors the open to the midpoint of the previous bar's body. Standard charts keep full detail but carry noise; Heikin-Ashi reads smoother and clearer in trends, but its open and close are recomputed values and its signals lag.
Q2: Why does Heikin-Ashi have almost no gaps?
Because of how the open is defined. Every bar's open sits at the midpoint of the previous bar's body, so each bar is born inside its predecessor and the chart stays connected. A real market gap shows up in the bar's body and shadow lengths — but never as a visible gap.
Q3: Can I trade from Heikin-Ashi alone?
Not advisable. Heikin-Ashi is built for judging trend direction and managing positions, but its open and close are computed values — orders, stops, and targets have to go back to real quotes — and precise entry structure still needs standard candles or other tools. In practice it's a two-chart job: Heikin-Ashi judges, the standard chart executes.
Q4: Which timeframes suit Heikin-Ashi?
The formula works identically on any timeframe; what changes is the noise ratio. The shorter the timeframe, the larger the share of noise, and color flips stay frequent even after averaging. On larger frames (H1 and up) the unbroken color runs of trending stretches tend to be steadier. Rather than fixing one timeframe, the practical read is multi-timeframe: higher frame for direction, lower frame for timing.
Q5: Is Heikin-Ashi built into MT4/MT5?
Yes. MT5: "Insert" → "Indicators" → "Custom" → "Heiken_Ashi"; MT4: the Custom category under "Insert" → "Indicators". Note the platform spells it "Heiken" (listed as Heiken_Ashi) — same indicator. Titan FX additionally provides the Smoothed version and the five-timeframe status panel as dedicated indicators for Windows MT4/MT5.
Q6: How does Heikin-Ashi Smoothed differ from the standard version?
The Smoothed version adds two processing layers: it smooths price with a moving average before computing the bars, and its built-in filter carries the previous bar's values forward whenever the change stays inside a set range. The picture gets cleaner and false signals rarer, but reaction slows further — wrong for catching a move's first leg, right for swing traders who value signal stability.
8. Conclusion
Heikin-Ashi trades a simple set of averages for a far smoother chart: unbroken color runs mark trend continuation, expanding bodies mark conviction, and shadows pinned to the trend side mark strength. For trend followers, the hardest job in trading — staying with a winning trend — becomes a discipline with something visible to lean on.
Two costs come with the deal, and they define how to use it. The displayed prices are computations, so execution always returns to real quotes. And smoothness buys lag, so Heikin-Ashi confirms trends rather than predicting turns. Keep the division of labor — Heikin-Ashi judges, real prices execute — and it becomes the lowest-maintenance trend filter on the chart.
Further Reading
- Advantages and Disadvantages of Candlestick Charts: Purpose and Importance of Learning Candlesticks
- Reversal Patterns: Key Features and Trading Strategies
- Bullish Candlestick Patterns in Forex and Stock Trading
- Bearish Candlestick Patterns:Hanging Man & Three Black Crows
- Bollinger Bands Complete Guide: Principles, Standard Deviation, Formula, Pros & Cons and MT4/MT5 Plotting
Titan FX Research Team. We cover a broad set of financial instruments — foreign exchange, commodities (crude oil, precious metals, agricultural products), equity indices, US equities, and digital assets — producing practical, research-backed educational content for traders.
Primary Sources (by Category)
- Theory: the standard definitions of the traditional Japanese Heikin-Ashi technique; Steve Nison, Japanese Candlestick Charting Techniques (the systematic introduction of Japanese charting)
- Platform and tools: Titan FX's Heikin-Ashi Smoothed and Titan_Heikinashi_checker indicator pages (Windows MT4/MT5); MetaQuotes MT4/MT5 platform documentation (the built-in Heiken_Ashi)
- Market data: Titan FX price feeds and intraday volatility data