

RCI Indicator (Rank Correlation Index): Formula, ±80 Levels, 9/26/52 Settings and MT4/MT5 Setup
RCI is widely used by forex and stock traders in Japan, usually with three lines, short, medium and long term, shown together. Because RCI is calculated from the rank of each price within the period rather than from the size of price moves, traders often use it to judge whether a trend is continuing.
This guide covers how RCI is calculated, how to read its values, the usual settings and how to use three RCI lines, how RCI differs from RSI and the Stochastic Oscillator, and how to use RCI on MT4/MT5.
- RCI uses Spearman's rank correlation to measure how closely date ranks match price ranks, on a scale from -100 to +100
- Values near +100 mean prices have been rising steadily over time, and values near -100 mean they have been falling steadily. ±80 is a common reference for stretched conditions
- The usual periods are 9, 26 and 52 for the short, medium and long term. Using all three helps you judge trend strength and turning points
- RCI is calculated from price ranks, so it behaves differently from RSI, which is calculated from the size of price changes
- MT4/MT5 have no built-in RCI, so you need a custom indicator. Titan FX offers two free RCI indicators
- 1. What Is the RCI Indicator?
- 2. How RCI Is Calculated
- 3. How to Read RCI: Values and ±80
- 4. RCI Settings: Choosing 9, 26 and 52
- 5. How to Trade with RCI
- 6. RCI vs. RSI vs. Stochastic Oscillator
- 7. Downloading and Installing an RCI Indicator for MT4/MT5
- 8. Strengths and Limitations of RCI
- 9. RCI FAQ
- 10. Conclusion
1. What Is the RCI Indicator?
RCI stands for Rank Correlation Index. It ranks each candlestick in a period twice: once by date (newer ranks higher) and once by closing price (higher ranks higher). It then calculates how closely the two sets of ranks match.
-
If newer candlesticks have higher prices, the two rankings almost match and RCI moves toward +100, which points to a clear uptrend
-
If newer candlesticks have lower prices, the two rankings are reversed and RCI moves toward -100, which points to a clear downtrend
-
If prices move back and forth with no direction, the two rankings are unrelated and RCI stays near 0
RCI is an oscillator. Like RSI and the Stochastic Oscillator, it moves within a fixed range, but it is calculated from ranks rather than price changes.
2. How RCI Is Calculated
RCI is based on Spearman's rank correlation coefficient from statistics. The formula is:
Formula: RCI = (1 − 6 × Σd² ÷ (n × (n² − 1))) × 100
n is the period (number of candlesticks), and d is each candlestick's date rank minus its price rank.
Here is a simple five-candlestick example:
Setup: Period n = 5, with closing prices of 100, 102, 101, 104 and 105 from oldest to newest
Step 1: Rank by date. The newest close, 105, ranks 1st and the oldest, 100, ranks 5th
Step 2: Rank by price. The highest price, 105, ranks 1st and the lowest, 100, ranks 5th. 102 ranks 3rd, 101 ranks 4th and 104 ranks 2nd
Step 3: Find each difference d. For 100, 104 and 105, both ranks are the same, so d = 0. For 102, the date rank is 4 and the price rank is 3, so d = 1. For 101, the date rank is 3 and the price rank is 4, so d = −1
Step 4: Σd² = 0 + 1 + 1 + 0 + 0 = 2. Plugging into the formula gives RCI = (1 − 6 × 2 ÷ (5 × 24)) × 100 = 90
Prices dipped slightly once in these five candlesticks but rose steadily overall, so RCI is +90.
Platforms may rank prices slightly differently, for example when two prices are equal, so the same price action can produce slightly different RCI values on different platforms.
3. How to Read RCI: Values and ±80
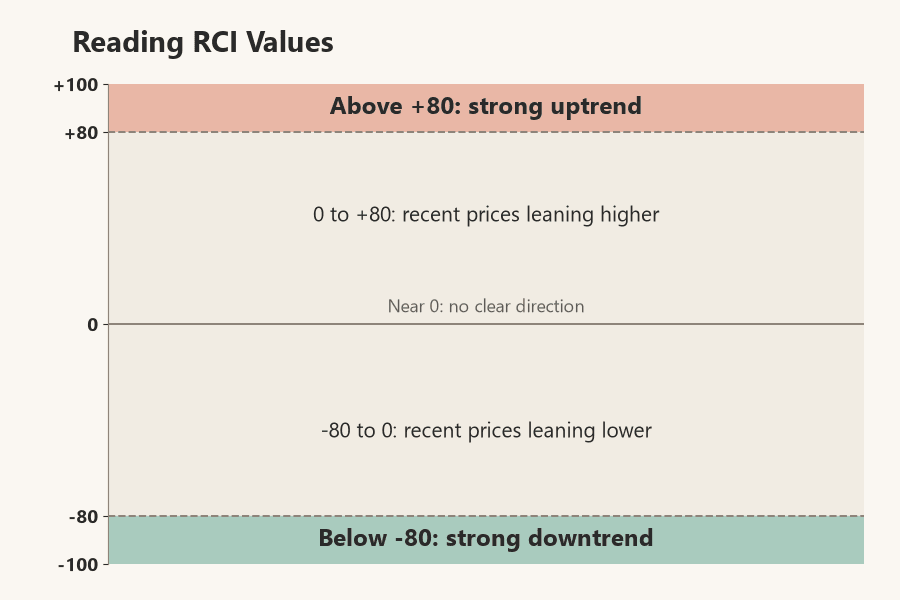
RCI values can be read in zones:
-
Above +80: Recent prices rank near the top of the period, which shows a strong uptrend. It does not mean prices must fall next
-
Below -80: Recent prices rank near the bottom of the period, which shows a strong downtrend. It does not mean prices must rebound next
-
Near 0: Prices have no clear direction, which is common in ranging markets
-
Crossing 0: A move from negative to positive shows recent prices starting to rise, and a move from positive to negative shows them starting to fall
±80 is a common reference level, not a fixed buy or sell signal.
4. RCI Settings: Choosing 9, 26 and 52
The most common RCI periods are 9, 26 and 52, and Titan FX's RCI indicators use these three as defaults:
| Period | Use | Behavior |
|---|---|---|
| 9 (short term) | Gauges recent momentum to time entries and exits | Fast, with many signals |
| 26 (medium term) | Shows the short- to medium-term trend | Between short and long term |
| 52 (long term) | Shows the medium- to long-term trend direction | Slow, with fewer but steadier signals |
The period is measured in candlesticks. On a 1-hour chart, a period of 9 covers the last nine hours; on a daily chart, it covers the last nine days.
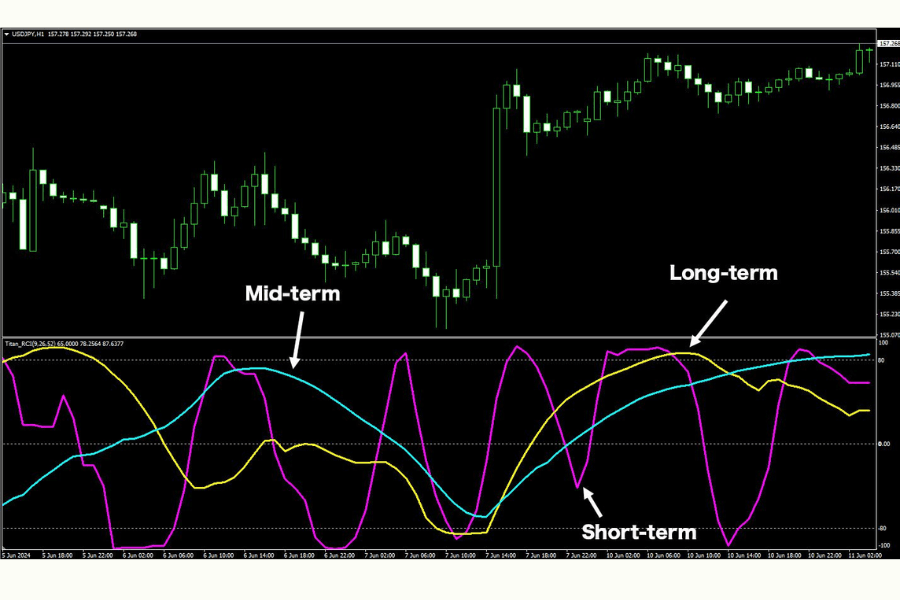
Showing all three RCI lines in one window lets you see short-term momentum and the longer-term direction at the same time. For example, if the long-term RCI is above 0 and the medium-term RCI is rising, the broader trend is up. A short-term RCI turning up from low levels at that point is often used as a reference for buying with the trend.
5. How to Trade with RCI
There are three common ways to use RCI:
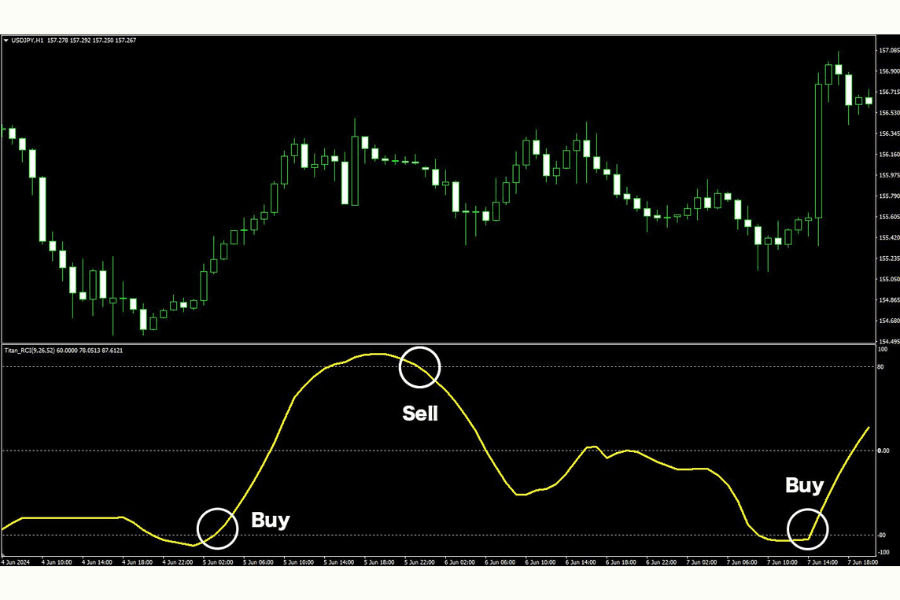
- ① Turning back from beyond ±80: When RCI rises above +80 and then falls back below it, upward momentum is starting to fade. This can be a reference for selling or taking profit. A move from below -80 back above it works the other way
- ② Short-term and long-term RCI crossovers: When the short-term RCI crosses below the long-term RCI, upward momentum is weakening; when it crosses above, downward momentum is weakening. The idea is similar to a moving average golden cross or death cross
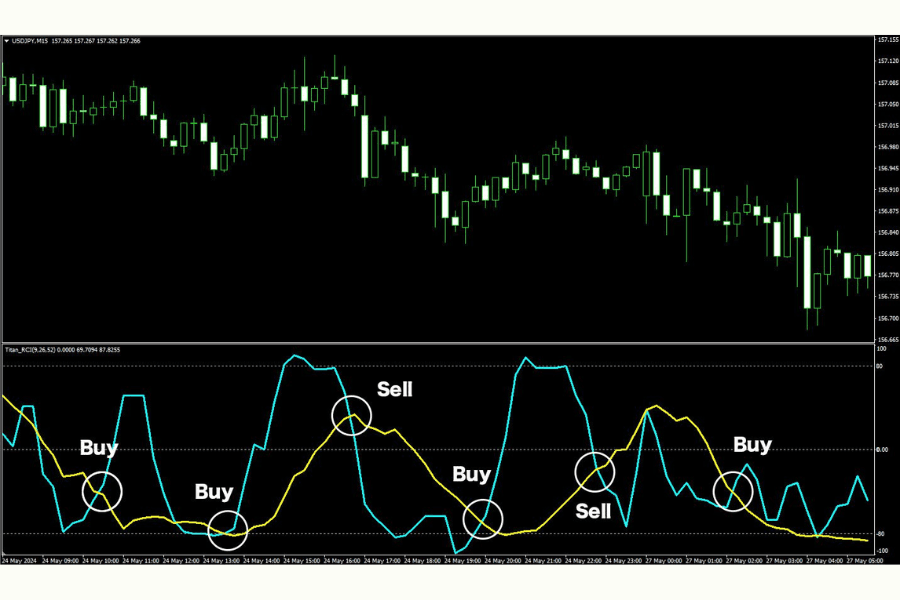
- ③ The order and direction of three RCI lines: When the lines run short, medium and long term from top to bottom and all point up, the uptrend is strong. When they run long, medium and short term from top to bottom and all point down, the downtrend is strong
Crossovers and changes in order can give false signals. Confirm them with trendlines, support and resistance, or the trend on a higher timeframe.
6. RCI vs. RSI vs. Stochastic Oscillator
RCI, RSI and the Stochastic Oscillator are all oscillators, but they are calculated from different things:
| Indicator | Based on | Range | Behavior |
|---|---|---|---|
| RCI | Correlation between date ranks and price ranks | -100 to +100 | Calculated from ranks; well suited to judging whether a trend continues |
| RSI | Ratio of gains to losses over a period | 0 to 100 | Affected by large single-day moves |
| Stochastic | Where the close sits between the period's high and low | 0 to 100 | Fast; good for catching short-term turns |
For example, if prices jump sharply one day, RSI rises in proportion to the size of the gain. RCI looks at where that day's price ranks within the period, so the size of the gain itself does not show up directly. RCI still changes whenever price ranks change, and how quickly it reacts also depends on the period.
7. Downloading and Installing an RCI Indicator for MT4/MT5
MT4 and MT5 do not include RCI, so you need to install a custom indicator. Titan FX offers two free RCI indicators. Both come in MT4 and MT5 versions, but they work only on the Windows versions of Titan FX's MT4/MT5.
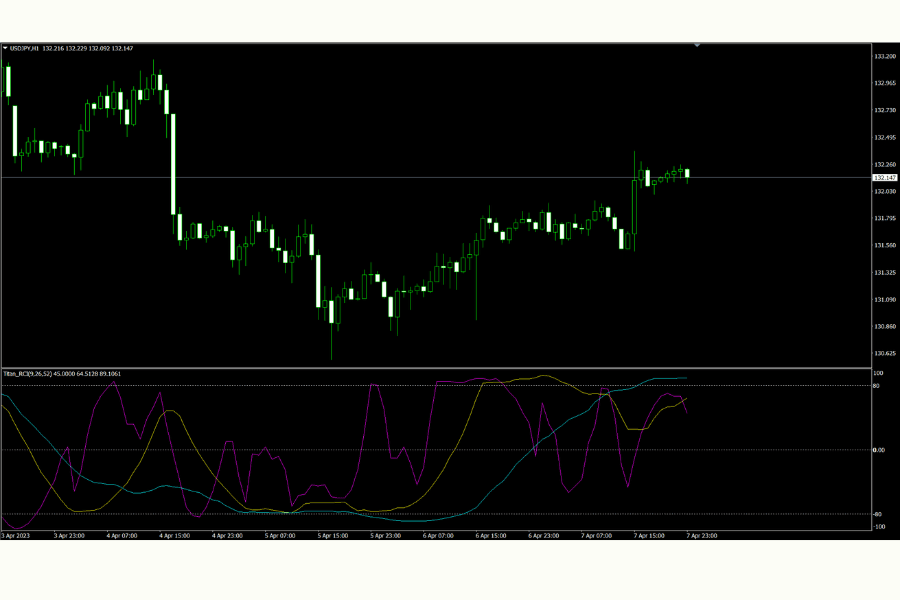
Titan_RCI: three RCI lines at once
Titan_RCI shows short-, medium- and long-term RCI lines in a subwindow. The default periods are 9, 26 and 52, and you can change the periods and line colors. It suits traders who want to watch the three lines' positions and crossovers themselves.
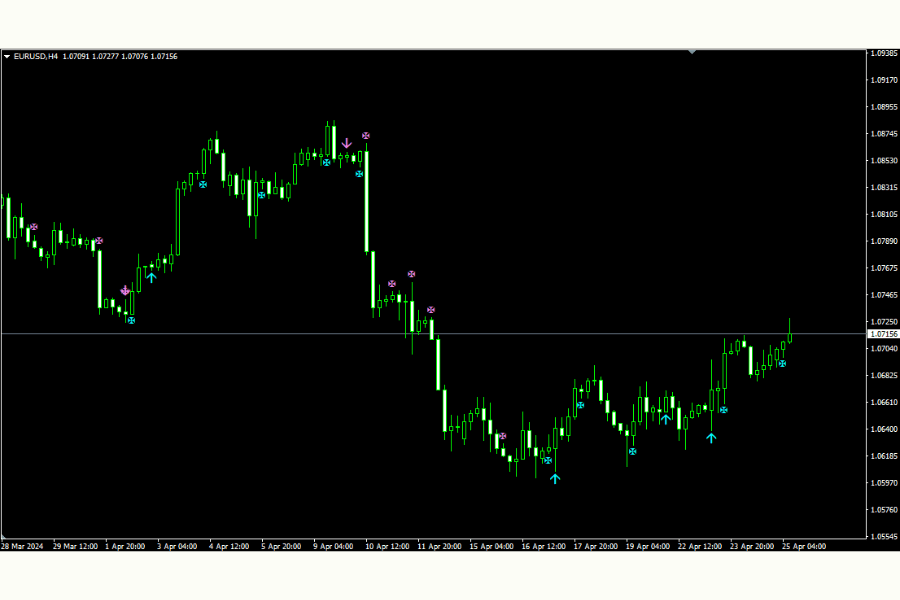
Titan_perfectorder_RCI: alerts for the order and direction of three RCI lines
Titan_perfectorder_RCI shows an arrow when the three RCI lines line up in order (short on top and long at the bottom, or the reverse) and a mark when all three slope in the same direction. You can also set alerts. It suits traders who want marks and alerts instead of watching three lines all the time.
After downloading, copy the indicator file into the "Indicators" folder inside "MQL5" (or inside "MQL4" for MT4), restart the platform, and drag the indicator from "Indicators" in the Navigator window onto a chart. For the full steps, see Installing Custom Indicators in MT5 and Installing Custom Indicators in MT4.
8. Strengths and Limitations of RCI
Strengths
-
Not driven directly by the size of price moves: RCI looks at price ranks, so the size of a single candlestick's move does not directly inflate the value
-
Shows clearly whether a trend continues: When RCI stays high or low, prices are moving steadily in one direction
-
Works well in combination: Short-, medium- and long-term RCI lines show the direction over different time spans at once
Limitations
-
Many signals in ranging markets: Without a trend, RCI moves back and forth around 0 and crossover signals often fail
-
Can stay pinned in strong trends: In a strong trend, RCI can stay beyond ±80 for a long time, and trading against the trend early because of ±80 alone often leads to losses
-
Does not show the size of moves: RCI only looks at ranks, so it cannot tell you how far prices moved. Use it together with price action and other indicators
9. RCI FAQ
Q1. Which timeframe works best for RCI?
RCI works on any timeframe. The period is measured in candlesticks, so a period of 9 covers the last 45 minutes on a 5-minute chart and the last nine days on a daily chart. Short-term traders often use 5-minute to 1-hour charts, while medium- to long-term traders use 4-hour or daily charts.
Q2. Can I use RCI on stocks, gold or stock indices?
Yes. RCI only needs price data, so it works on forex, stocks, gold and stock indices. Each market moves differently, though, so it helps to watch how RCI behaves on that market on a demo account first.
Q3. Can I use RCI on Mac or mobile MT5?
Mobile MT4/MT5 have no built-in RCI. Titan FX's Titan_RCI and Titan_perfectorder_RCI work only on the Windows versions of Titan FX's MT4/MT5, so they cannot be used on Mac or mobile.
10. Conclusion
RCI measures how closely the order of dates matches the order of prices over a period, on a scale from -100 to +100. Values near +100 show a steady rise, values near -100 a steady decline, and ±80 is a common reference for stretched conditions.
In practice, traders often show 9-, 26- and 52-period RCI lines together and judge the trend from turns back from beyond ±80, short- and long-term crossovers, and the order of the three lines. MT4/MT5 have no built-in RCI, so Titan FX's free RCI indicators are a convenient option.
Further Reading
Titan FX Research Team. We cover a broad set of financial instruments — foreign exchange, commodities (crude oil, precious metals, agricultural products), equity indices, US equities, and digital assets — producing practical, research-backed educational content for traders.
Primary Sources (by Category)
- Calculation: Statistical definition of Spearman's rank correlation coefficient
- Titan FX materials: Titan_RCI and Titan_perfectorder_RCI indicator pages; guides to installing custom indicators on MT4/MT5