
 Home
Home- Investment Guide: Strategies for Stocks, Forex, and Metals
- How to Read an Instrument Page: EUR/USD Block by Block
How to Read an Instrument Page: EUR/USD from Top to Bottom
Most people glance at the rate up top and close the tab. The page is laid out with a purpose, though: the verdict sits at the top, the evidence in the middle, costs and tools at the bottom. Read the middle and you find out where that verdict came from.
This article walks through the EUR/USD page in the order the page itself follows: what each block tells you, where it is easy to misread, and finally how to pull the six blocks together into one conclusion.
- The top of the page is a verdict: 12 indicators across 6 timeframes, 72 signals — but those 72 are not independent of one another
- Volatility gives you the 14-day ATR, which sizes a stop rather than calling a direction
- The support and resistance drawn on the chart is the Classic set from the five pivot methods further down
- The methods do not all give the same number of levels: DeMark gives three, Camarilla runs out to R4 and S4
- A micro lot is 1,000 units against 100,000 for the other two accounts, so cost per lot is not directly comparable
- The real use is checking whether the six blocks point the same way; the one that does not is where your risk sits
- 1. What is on this page and how to get there
- 2. Market Forecast at the top: how to read 72 signals
- 3. Rate & Chart: volatility, pivot levels and swap points
- 4. Support & Resistance: pick one pivot method first
- 5. Technical Analysis: two indicator tables and the official MTF guide
- 6. Trading Conditions and Tools: account terms and related tools
- 7. Turning six blocks into one conclusion
- 8. Frequently Asked Questions
- 9. Summary
1. What is on this page and how to get there
To open an instrument's page, start at Live Rates. Instruments are listed in a table, each row showing the bid, the ask, the spread between them and the day's change, with filters for forex, indices, commodities and crypto above.
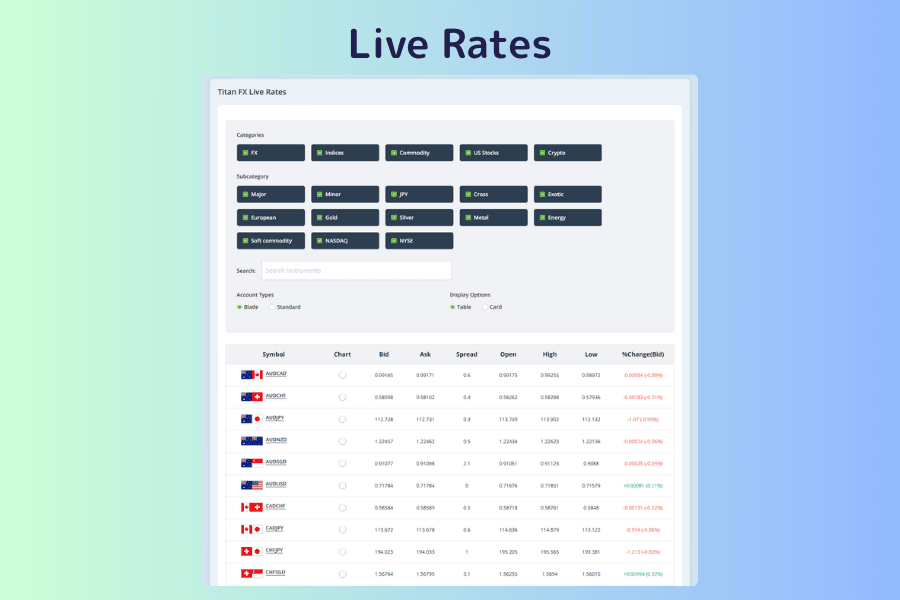
Click the instrument name on any row and you land on that instrument's own page. The URL reads instruments followed by the symbol code.
Five icon headings divide the page, with a market forecast block above them and nine basic questions at the bottom.
One small feature is worth knowing before you start. Every field label carries a question-mark icon that opens an explanation of the term. ATR, pivot points, how each technical indicator is calculated, how swap points are worked out — all of it expands in place. When a field makes no sense, press the question mark.
Open Live Rates2. Market Forecast at the top: how to read 72 signals
Before you reach the rate, the Market Forecast: Overall Assessment block appears. It gives one overall direction and shows what that rests on: a Technical Score of 12 indicators across 6 timeframes, 72 signals in total, with counts for buy, neutral and sell. Below that it breaks into six timeframe cards — 15m, 1H, 4H, Daily, Weekly and Monthly — each with its own direction, three counts, and a trend and oscillator subtotal.
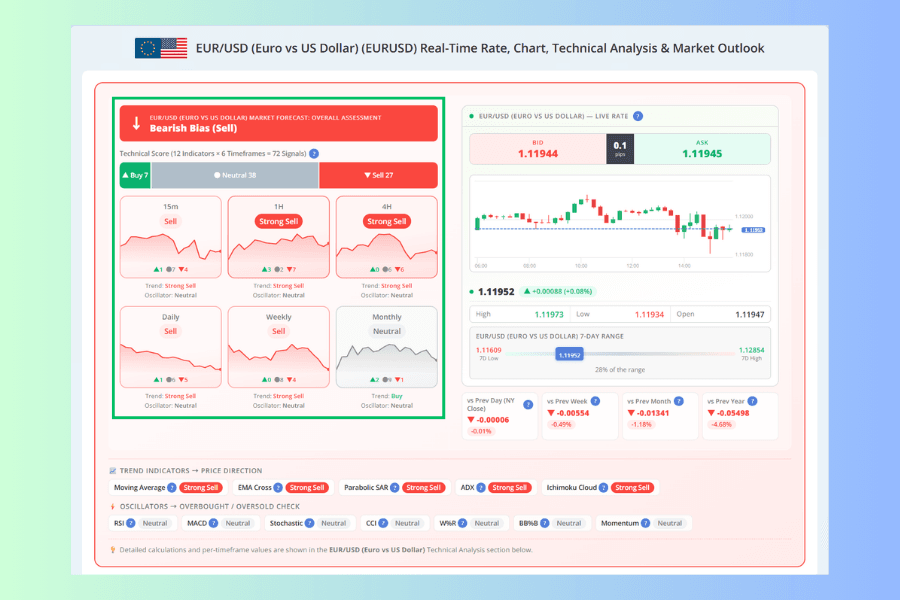
Start with this: 72 signals are not 72 independent judgments. Several of the 12 indicators rest on the same price data and closely related math, and adjacent timeframes move together. A buy count higher than the sell count tells you that more of the current rules lean that way. It tells you nothing about the probability of a rise.
The neutral count is rarely small. At the time of the screenshots here it stood at buy 7, neutral 38 and sell 27, with neutral above half. In practice the overall direction comes down to the handful of indicators that have taken a side.
So read the distribution, not the label at the top. A wide gap between buy and sell means the direction is reasonably clear. A narrow gap with a large neutral count means you should read the blocks below before deciding anything.
3. Rate & Chart: volatility, pivot levels and swap points
The top of this block is the rate and the candlestick chart, which switches between six timeframes. Bid and ask, and which side is the base and which the quote currency, are basics — so what follows covers the three items below the chart that tend to get scrolled past.
Volatility (14-Day ATR): for sizing a stop, not for calling a direction
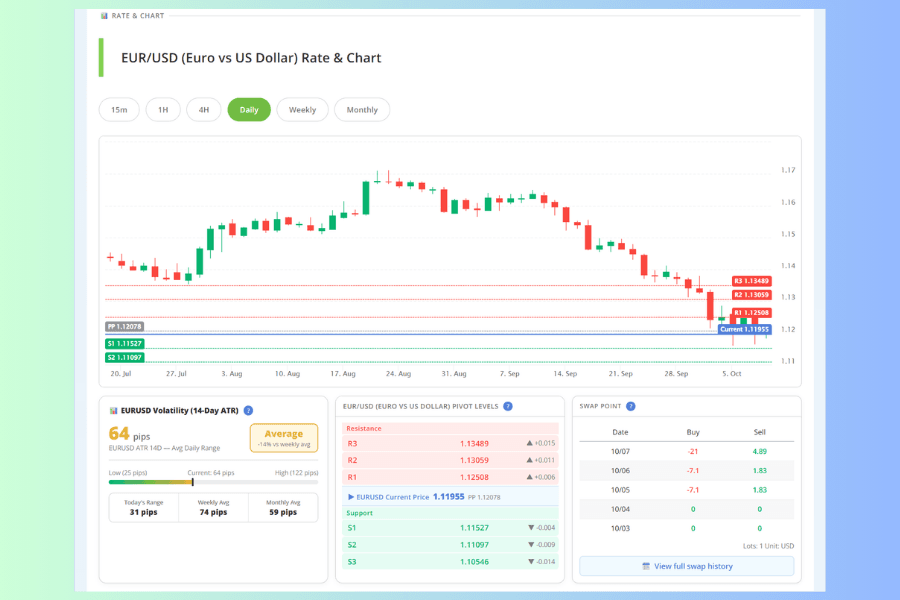
This gives the 14-day ATR — the average daily range over the past fourteen days, in pips — with today's range, the weekly average and the monthly average alongside it.
ATR tells you how far this instrument usually travels in a day. It says nothing about which way. Its use is distance: a stop placed closer than the average daily range gets taken out by ordinary intraday movement. When today's range sits well below the ATR, the session has not got going yet.
Pivot levels: the same set that appears further down
Here you get R3 down to S3 and how far each one sits from the current price. Note that these are the Classic method from the five in the Support & Resistance block below. The same set of levels appears twice on the page, and it is drawn on the chart above as well.
That means you are not looking at a second opinion. What this version adds is the chart: with the lines drawn in, you can see at a glance where price sits relative to them.
Swap points for the last five days
The columns are date, buy and sell, with a note underneath giving the lot size and the currency. Swap points are the interest paid or received on a position held overnight.
-
Buy and sell are calculated separately, and both sides can be negative. The direction mostly follows the interest rate differential between the two currencies, but the figure also carries funding conditions and the broker's own calculation, so there is no guarantee that one side will be positive.
-
A zero in the table does not mean those two days were free. Spot FX settles two business days out, so a position held through Wednesday settles on Monday and picks up three days of interest at once — the triple swap. In the screenshots here the buy figure for 10/07 is -21 against -7.1 on each of the two days before it, close to three times. Wednesday is the usual day for the major pairs, though it shifts with the instrument and around holidays.
-
These five figures are not your cost. They are per lot, and they are history. What you actually pay depends on direction, lot size, how many nights you hold and the rate applied on the day. To look further back, the link beneath the table opens the swap calendar.
4. Support & Resistance: pick one pivot method first
This block comes in two parts, one built on pivot points and one on moving averages.
The pivot point half carries five tabs: Classic, Fibonacci, Camarilla, Woodie and DeMark. All five work from the same prior-period high, low and close, but the formulas differ, so the levels differ too. The table runs resistance, current price and support from top to bottom, with the distance in pips on every row. They do not all give the same number of levels: Classic, Fibonacci and Woodie give R3 through S3, Camarilla runs out to R4 and S4, and DeMark gives only R1, PP and S1.
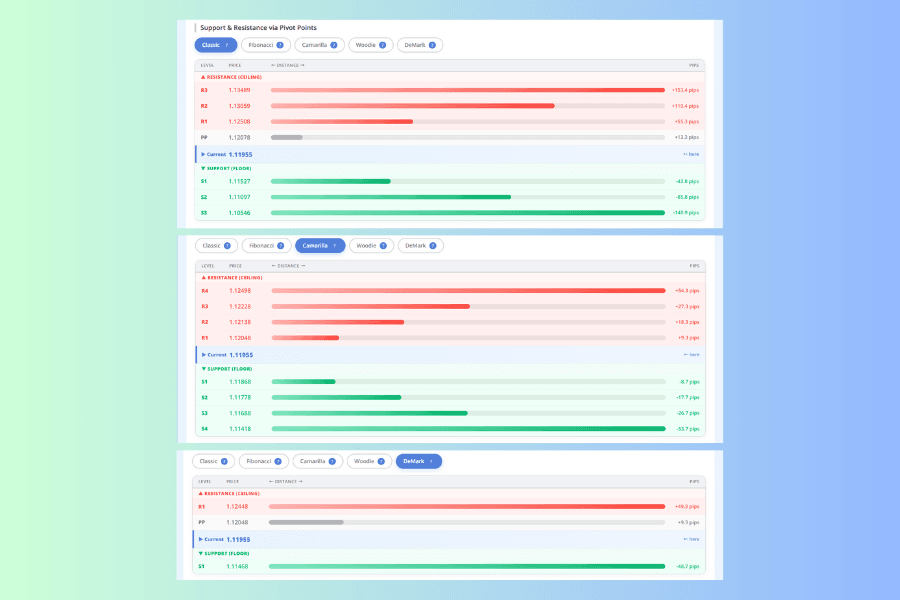
Switch between tabs and the gap is obvious. In EUR/USD at the time of these screenshots, the Classic S3 sat 140.9 pips from the current price while the Camarilla S3 was 26.7 pips away. With an average daily range of about 64 pips, the first would take more than two days to reach; the second could be hit inside half a session. That gap moves with the prior period's prices, so work from whatever the table shows when you open it.
| Tab | How the levels are derived |
|---|---|
| Classic | The most widely used, with the best-known calculation |
| Fibonacci | PP matches Classic; R and S are spaced by Fibonacci ratios |
| Camarilla | Eight levels out to R4 and S4, the tightest spacing and the closest to price |
| Woodie | Weights the close more heavily, so it reacts to the latest bar |
| DeMark | R1, PP and S1 only |
Switch to DeMark and the table shrinks to three rows. That is the method, not a failure to load.
The point is to settle on one before you use any of them. Looking at all five at once leaves you with a pile of contradictory levels, which is no better than having no reference at all.
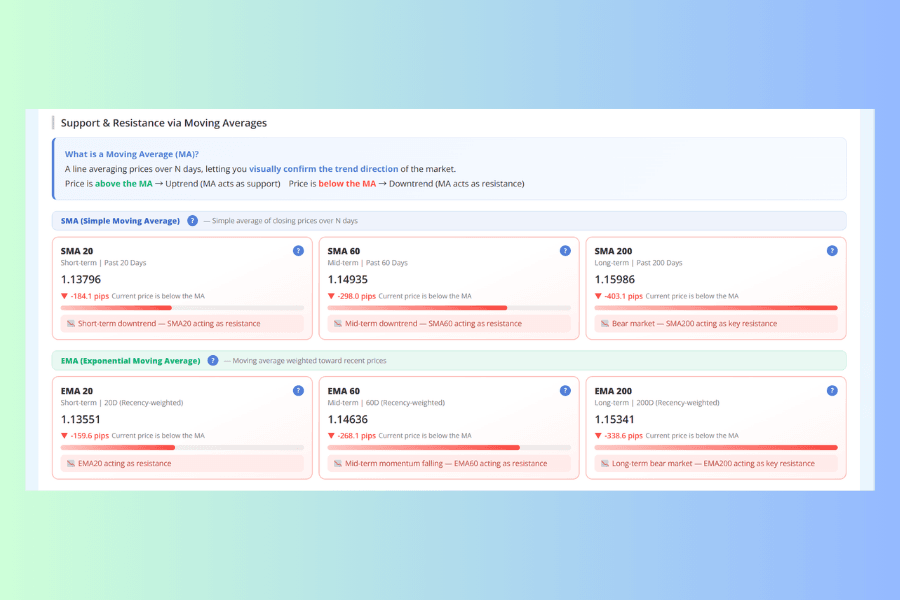
The lower half — support and resistance from moving averages — works on different logic. It lists the 20, 60 and 200-period SMA and EMA, with how far the current price sits from each in pips and whether price is above or below the line. A moving average shifts over time, so it can be cross-checked against the fixed pivot levels. Where the two methods point at similar prices, that area is worth more attention.
5. Technical Analysis: two indicator tables and the official MTF guide
The six timeframe cards at the head of this block hold the same figures as the one at the top of the page — same directions, same counts. What is new is the two tables below them.
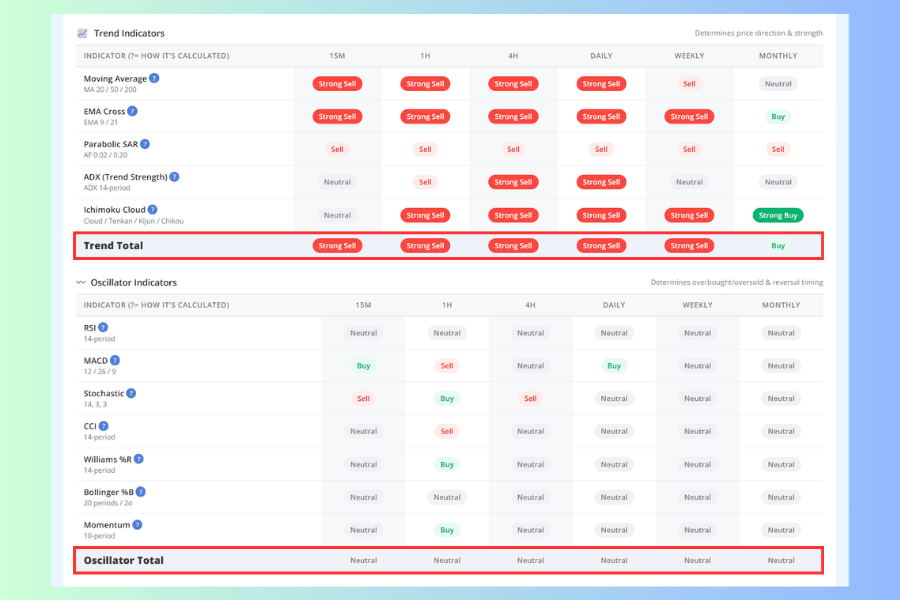
The Trend Indicators table has five entries and the Oscillators table has seven, with the same six timeframes across the top of both. The parameters sit next to each indicator name, and each table closes with a total row.
You do not have to work multi-timeframe analysis out for yourself. The official MTF (Multi-Timeframe) guide sits below this block, setting out the order for working down from the monthly chart to the 15-minute one in four steps, then the role of each of the six timeframes, and closing with a warning about the false signals that come from reading oscillators in isolation. The concepts are covered there.
Two practical reading problems are worth adding.
A column of matching colors is not several independent signals. In the trend table, the moving average, the EMA cross and the Ichimoku cloud all rest on moving averages and turn together in a trending market. It looks like three indicators agreeing; it is one thing counted three times. That is also why the 72 signals at the top cannot be read as 72 independent judgments.
When the whole oscillator row is one color, check which color. The seven oscillators each have their own thresholds. Some, like RSI, can sit at overbought for long stretches in a strong trend; others hold neutral throughout. A row of neutral means these indicators are not taking a side right now, so the direction has to come from the trend table. A row of overbought or oversold is a different matter, and usually means the trend is strong rather than that a reversal is close.
6. Trading Conditions and Tools: account terms and related tools
Three accounts: contract size first, spread second
The Trading Conditions block puts the average spread, commission, minimum lot and contract size for the same instrument side by side across three account types.
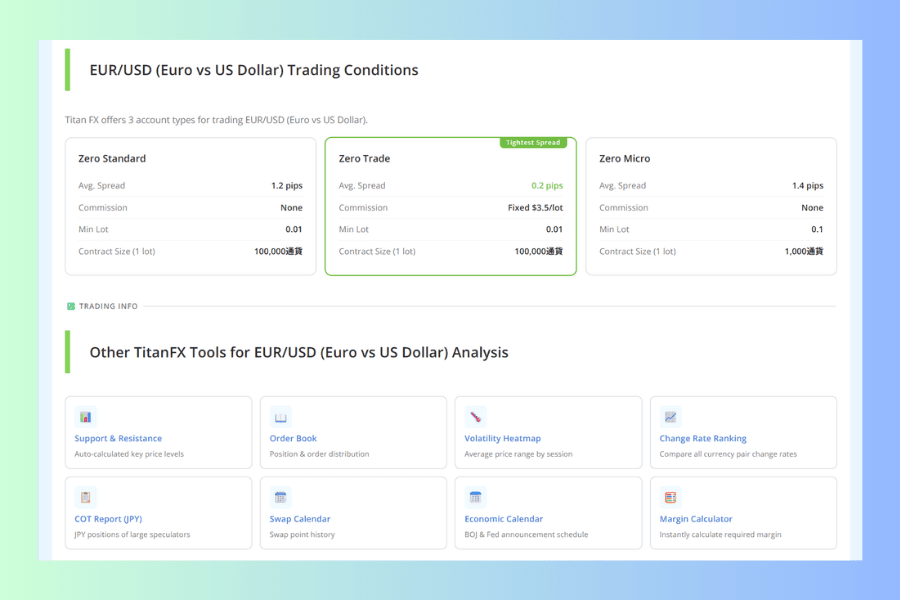
The item most often misread is contract size. One lot on the standard and trade accounts is 100,000; one lot on the micro account is 1,000. You can compare the pip figures directly, but cost per lot differs by a factor of a hundred, so comparing account costs means converting both to the same notional first. The trade account also pairs the tightest spread with a commission on top.
Account names need matching up too. The page labels them Zero Standard, Zero Trade and Zero Micro, while the main site and our other articles use Standard, Blade and Micro. The one with the commission is Blade.
Related tools at the bottom
Near the bottom of the page sits a section headed Other TitanFX Tools, with eight links grouped into price levels, positioning, trading costs and event risk. Each one opens the corresponding tool page.
7. Turning six blocks into one conclusion
Reading block by block only teaches you the fields. The real use of this page is putting several of them side by side and asking whether they point the same way. Read top to bottom, EUR/USD at the time of these screenshots looked like this.
- Overall assessment: bearish bias (sell), with buy 7, neutral 38 and sell 27. Sell runs close to four times buy, but neutral is over half, so this block alone settles nothing.
- Six timeframe cards: 15m sell, 1H and 4H strong sell, daily and weekly sell, monthly neutral. Five of the six lean down.
- Trend indicator total: strong sell from 1H through weekly, with only the monthly column on buy.
- Oscillator total: neutral across all six timeframes. Nothing is oversold, so there is no reversal signal either.
- Moving average levels: the 20, 60 and 200-period SMA and EMA all sit above the current price, and even the nearest is around 160 pips away.
- Pivot levels: price is below the PP, about 43 pips above S1.
- Seven-day range: price sits 28% of the way up the range, nearer the floor.
- Swap points: the buy column is negative, so a long position pays to hold; the sell column is positive.
Seven of the eight point the same way: down over the medium term, with no sign of a short-term reversal. The one that does not is the monthly column, where the trend total reads buy.
That is what this page should give you. The parts that agree point to the direction worth trading with; the one that does not shows you where the risk is. Here, the risk in a short is that the monthly structure has not turned and that price already sits near the floor of its seven-day range, which is a poor place to chase. Entry price, stop distance and position size are not on this page at all, and the ATR gives you only a lower bound for a stop.
Open it at another moment and the figures will be completely different, but the method does not change: count how many blocks agree, then find the one that does not.
8. Frequently Asked Questions
Q1: Why do the moving average periods read 20/60/200 in one place and 20/50/200 in another?
Because they are two different settings. The SMA and EMA in the lower half of Support & Resistance use the 20, 60 and 200-period lines, while the moving average in the Technical Analysis trend table uses 20, 50 and 200. The medium-term line is not the same in both, so when you cross-check, work from the figures inside one block.
Q2: ATR reads 64 pips and today's range is 31 pips. Which do I use?
ATR, if you are sizing a stop. It represents how far this instrument has typically traveled in a day over the past fourteen days. Today's range only tells you the session has been quiet so far, and nothing about how much it will move from here.
Q3: The overall assessment points a different way from what I see elsewhere.
Different indicator sets, parameters and timeframes produce different aggregates. This page uses 12 indicators and 6 timeframes; another site might use 10 and 4. There is no need to reconcile them. What matters is knowing how the one in front of you is calculated.
Q4: Can the technical analysis on this page be used as an entry signal?
It aggregates the state of indicators across timeframes, and it contains no entry price, no stop and no position size. The sensible use is as a second opinion to set against your own read.
Q5: The spread figures do not match what I get filled at.
Those are average levels. Actual spreads move with liquidity and widen around data releases and in thinner sessions.
Q6: The rate here is different from the one in MT4/MT5.
Update timing, the rate source and the account type in play can all differ, and bid and ask are not displayed the same way. Treat the figures here as analysis; what you trade on is the platform's rate at that moment.
9. Summary
This page puts the verdict at the top, the evidence in the middle and costs and tools at the bottom. Reading from the top hands you the answer first, but whether that answer is worth trusting only becomes clear once you have read the middle.
The costliest misreading is probably the micro account. One lot is a hundredth of the others, so the spreads look close while the cost per lot differs by a factor of a hundred.
Used as a pre-trade checklist, this page is faster than chasing the same information across separate tools. If you are still choosing an instrument, How to Choose a Currency Pair is the step upstream of this one.
Further Reading
- What Is Technical Analysis? Key Indicators and Practical Use
- Forex Trading Hours & Time Zones: Best Times to Trade
- What Is Currency Correlation? Patterns, Risk Management and Titan FX Tools
- Bid
The financial markets research team at Titan FX. We produce educational content for investors across a broad range of instruments, including foreign exchange, commodities such as crude oil, precious metals and agricultural products, equity indices, US stocks and digital assets.
Primary Sources (by category)
- Pages and tools: Titan FX Research Live Rates, the EUR/USD instrument page and the swap calendar (screen figures captured on 8 October 2026)
- Specifications: Titan FX account types and trading conditions pages