
 Home
- Investment Guide: Strategies for Stocks, Forex, and Metals
- How to Use the Chart Pattern Scanner: Completion Guide
How to Use the Chart Pattern Scanner: Reading Completion, Channels and Success Rates
The tool page already includes a full user guide covering the scanner table layout, the formation conditions for each pattern and the target price formulas. In practice, what traders tend to misread are a few of the numbers on screen. "Completion" means something different for each pattern type, and channels, the most common signal in the table, have no target price or success rate.
This guide explains when the scanner is useful, how to read completion, channel signals, success rates and samples, what the scanner cannot judge, and walks through an example from the scanner table to the checks before placing a trade.
- The scanner narrows down which instruments and timeframes are showing patterns; entry and exit decisions still need to be confirmed on the chart
- Completion means something different for head and shoulders, double tops and bottoms, flags, triangles and channels. For a channel, it measures trend clarity and is capped at 99%
- Most signals in the scanner table are rising or falling channels. Channels have no breakout concept, so no target price or success rate is calculated for them
- The success rate is the historical share for a pattern type across all instruments and timeframes combined, and should be read together with the sample count
- The scanner's formation conditions look only at price highs and lows; volume and events such as economic data releases are for you to check
1. When Should You Use the Chart Pattern Scanner?
The scanner's strength is covering 63 instruments and 5 timeframes at a glance, so you can see quickly where patterns are forming. It is useful in situations like these:
| Situation | What to look at in the scanner | What to do next |
|---|---|---|
| You want to find instruments worth watching today | The Featured Patterns cards and instruments with clusters of colored cells | Open the details and check that the shape is clear |
| You already have an instrument in mind and want to see each timeframe | The direction of that instrument's signals from M5 to D1 | Check whether short and long timeframes agree |
| You are looking for reversal patterns such as head and shoulders or double tops | Filter by Bullish or Bearish and look for reversal patterns near 100% completion | Check the neckline, then plan the stop and target |
| You want to know whether an open position has an opposing signal | Whether the same cell shows both a bullish and a bearish pattern | Consider whether to adjust the stop or reduce the position |
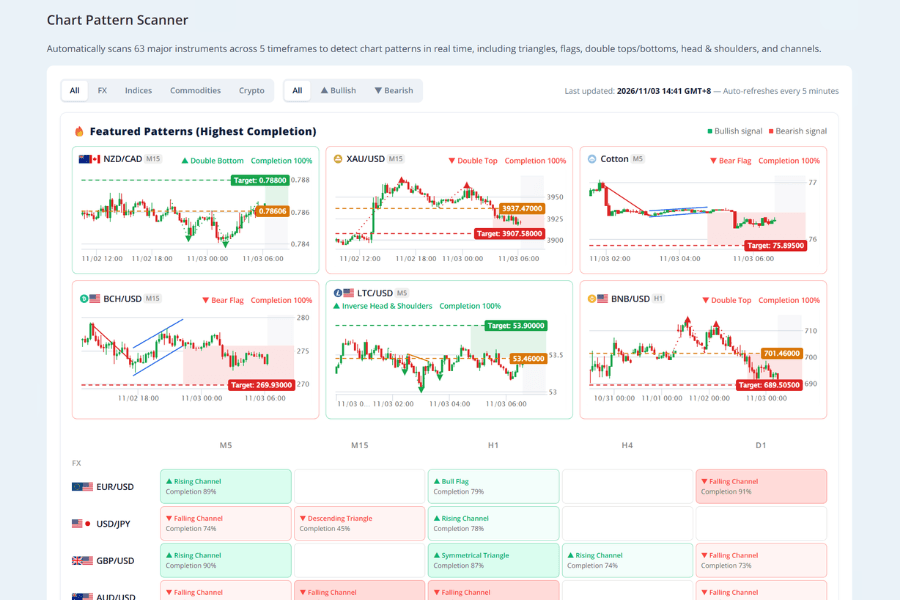
The scanner's job is to narrow the field. Final entry and exit decisions still belong on the candlestick chart, alongside your other analysis.
Open the Chart Pattern Scanner2. Completion: One Number, Different Meanings
Completion is the most prominent number in the scanner, but it is calculated differently for each pattern type:
| Pattern | What 100% completion means |
|---|---|
| Head and shoulders, double top and bottom | Price has broken through the neckline |
| Flag | Price has reached the flag's breakout line |
| Triangle | Price has reached the triangle's apex |
| Channel | Never reaches 100%; completion measures trend clarity, capped at 99% |
So 90% on a double top means price is very close to the neckline, 90% on a triangle means price is nearing the apex, and 90% on a channel only means the trend is quite clear. The three readings are not the same.
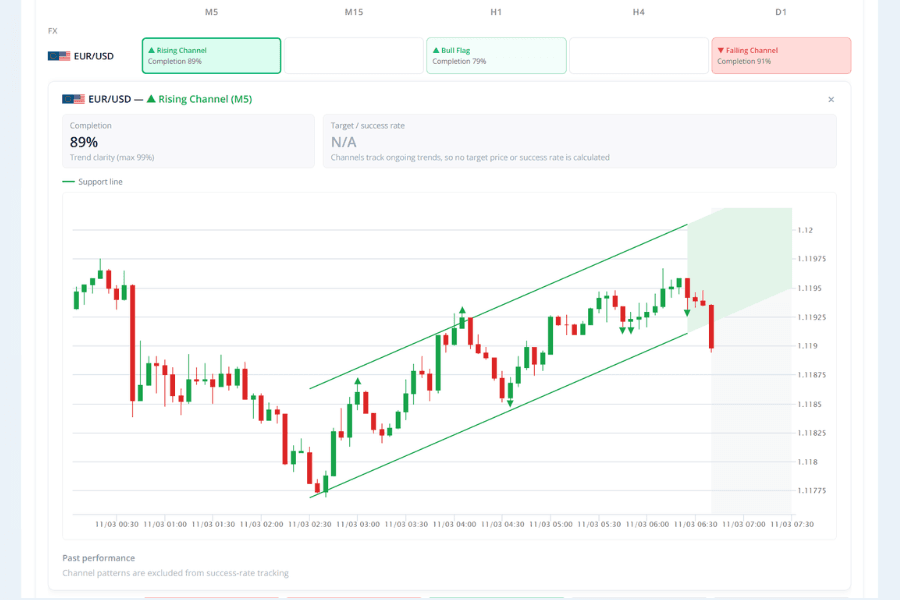
The scanner table also shows patterns with very low completion. The user guide only defines stages from 50% upward (50–79% still forming, 80–99% close to breaking out), warns that low-completion patterns often break shape, and recommends giving more weight to patterns at 70% or above.
Even 100% completion does not guarantee success. False breakouts, where price breaks out and then reverses, are common.
3. Why Are Most Signals Channels?
When you open the scanner table, most cells show a rising or falling channel. According to the formation conditions in the user guide, a channel only requires highs and lows to move at a similar slope. Patterns such as head and shoulders or double tops need a more specific arrangement of highs and lows, so their conditions are stricter.
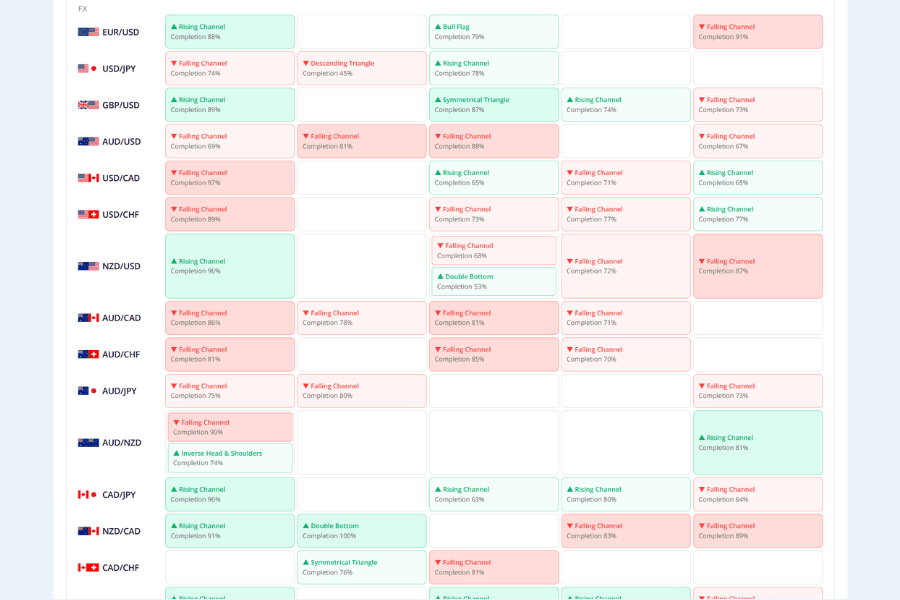
Keep three things in mind when you read channel signals:
-
Channels have no breakout point: the scanner treats channels as trend-monitoring patterns, so it does not calculate a target price for them or include them in success-rate tracking. In the details view, the Target / success rate field shows "N/A"
-
Read channels in Featured Patterns differently: Featured Patterns shows the top 6 patterns by completion, so a high-completion channel can appear there. It means the trend is very clear, not that a breakout is imminent
-
Use channels to read direction: if the same instrument shows channels in the same direction on several timeframes, the trend is consistent across them. A rising channel on a longer timeframe with a falling one on a shorter timeframe may simply be a pullback within an uptrend
For how to draw a channel, trade inside it and judge a breakout, see our guide to price channels.
4. How to Read Chart Pattern Success Rates and Samples
Open the details of a head and shoulders, double top or bottom, flag or triangle, and you will see a success rate and a sample count. The success rate is recorded as follows:
-
① Tracking starts once a pattern's completion reaches 100% (breakout)
-
② If price then reaches the target price, it counts as a success
-
③ If price reverses back to the pattern's starting level, or fails to reach the target within 40 candles of the breakout, it counts as a failure
The key point is that this success rate is the historical share for the same pattern type across all instruments and timeframes combined. It is not the win rate for the instrument and timeframe in front of you.
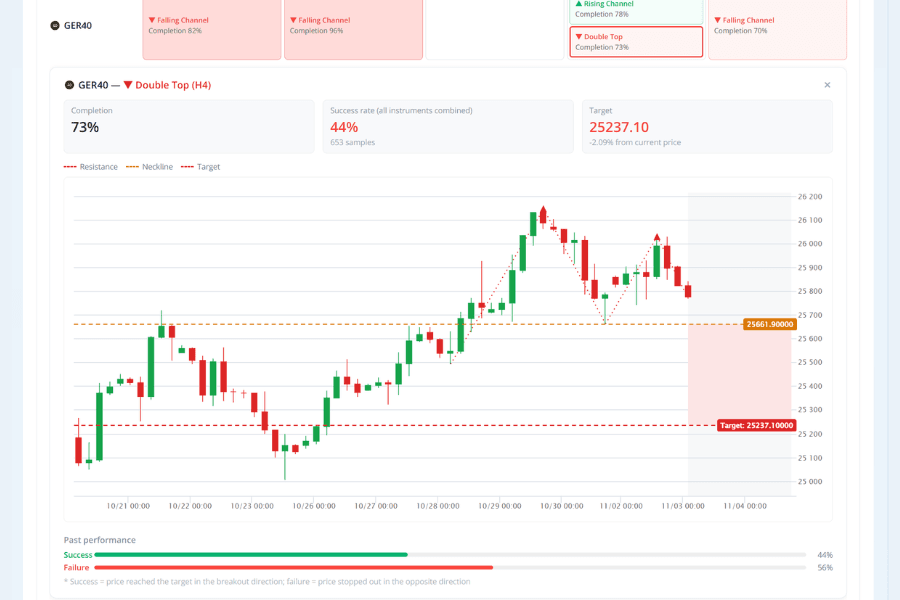
In the double top shown above, captured when this guide was written, the success rate was 44% from 653 samples. A larger sample means the share is less easily swayed by a handful of cases. A success rate below 50% means that, on its own, this pattern reached its target less often than it failed. That is why the risk-reward ratio matters: the distance to the target needs to be clearly larger than the distance to the stop for the trades to have a chance of breaking even or turning a profit over time.
A success rate shown as "—" means no track record has built up yet. When samples are few, a 100% rate from 3 out of 3 is less meaningful than 70% from 35 out of 50.
5. What the Scanner Cannot Judge
The scanner identifies patterns automatically from price highs and lows, so there are several things it does not see:
-
Volume: the user guide notes that a head and shoulders is more reliable when volume peaks at the head and shrinks at the right shoulder, but the formation conditions for each pattern list only price highs and lows. Whether volume supports the pattern is for you to check
-
Shape quality: the scanner uses fixed tolerances. For example, the two peaks of a double top may differ by about ±1.5%, and the trough between them must be at least 2% deep. These are the scanner's own criteria, and other traders may use different ones. Patterns that meet the conditions but look untidy are still listed, so check them on the chart yourself
-
Economic data and central bank decisions: technical patterns can stop working briefly around major releases. Check the economic calendar before entering and avoid major events
-
Noise on short timeframes: patterns on M5 and M15 change quickly, appearing and disappearing often, so they are usually less useful than those on H4 or D1
6. Example: From the Scanner Table to Pre-Trade Checks
Here is how the scanner fits into a real trading workflow:
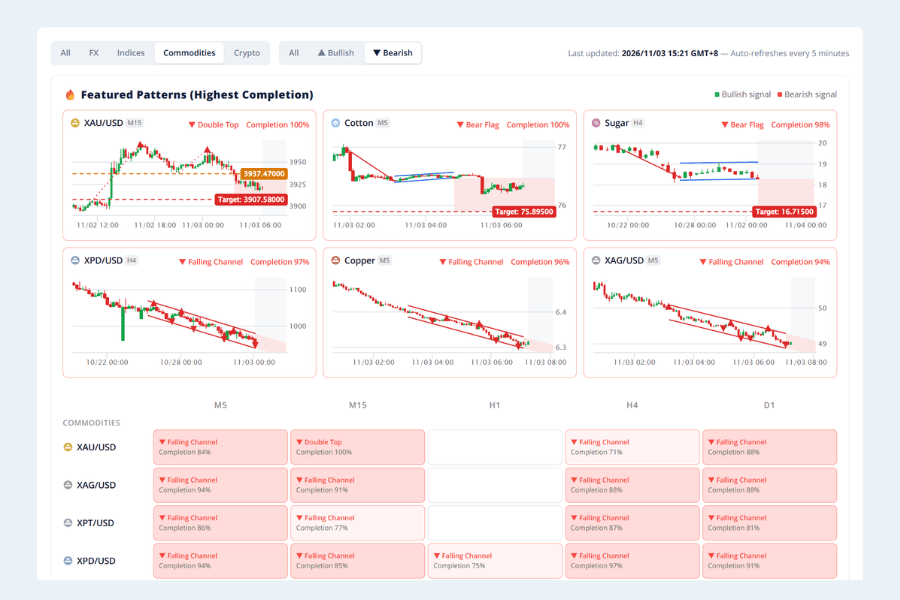
-
① Narrow the field: filter the scanner table to Bearish and look for reversal patterns at or near 100% completion, for example a double top on an instrument's M15 chart
-
② Check the detail chart: click the cell and confirm that the two peaks and the neckline are clear and that the shape looks like a double top
-
③ Check other timeframes: see whether the same instrument's H4 and D1 are also leaning lower, for example with a falling channel. If the longer timeframes still show a clear rising channel, the double top may only be a pullback within an uptrend
-
④ Plan the trade on MT4/MT5: use the target price from the details as a reference, place the stop above the two peaks, and work out whether the risk/reward justifies the trade. The target price is a theoretical value and may not be reached
-
⑤ Check for events: see whether any major economic data is due in the next few hours
For the formation conditions and trading methods of the patterns themselves, see our guides to double tops and bottoms and head and shoulders.
7. FAQ
Q1. How often does the scanner update?
Every 5 minutes, automatically. The time of the last update is shown at the top of the page. Patterns can appear or disappear between updates, so check back regularly.
Q2. What does it mean when the same cell shows both a bullish and a bearish pattern?
For example, a double top inside a rising channel. Opposing signals appearing together can be read as a warning that the trend may be turning. Check the direction of the longer timeframe and whether the neckline breaks before deciding what to do.
Q3. Why do symmetrical triangles have a color?
A symmetrical triangle can break either way. The scanner estimates the more likely breakout direction from where price currently sits and colors the cell accordingly, but the actual direction is only confirmed once price breaks a line.
Q4. Which patterns does the scanner cover?
Head and shoulders, inverse head and shoulders, double tops, double bottoms, rising and falling channels, bull and bear flags, and ascending, descending and symmetrical triangles. For the features of each, see our guides to flag patterns and triangle patterns.
8. Conclusion
The Chart Pattern Scanner is a quick way to narrow down which instruments and timeframes are showing patterns. Completion means different things for different patterns, and channels, the most common signal in the table, only show trend direction, with no target price or success rate.
The success rate is a historical share for each pattern type across all instruments, so read it alongside the sample count and the risk-reward ratio. The scanner looks only at price highs and lows; volume and economic events are for you to check, and final entry and exit decisions belong on the chart.
Further Reading
- Titan FX Market Analysis Tools
- Reversal Patterns: Key Features and Trading Strategies
- Wedge Patterns Explained
Titan FX Research Team. We cover a broad set of financial instruments — foreign exchange, commodities (crude oil, precious metals, agricultural products), equity indices, US equities, and digital assets — producing practical, research-backed educational content for traders.
Primary Sources (by Category)
- Titan FX tools: Titan FX Research Chart Pattern Scanner page and user guide, pattern details view (viewed November 3, 2026)