

Keltner Channel Explained: Formula, Trading Strategies and Bollinger Bands Comparison
Keltner Channels look a lot like Bollinger Bands, since both draw an envelope above and below price. The difference is how the width is calculated: Keltner Channels use ATR, while Bollinger Bands use standard deviation, so Keltner bands tend to change more smoothly.
This guide covers where the Keltner Channel comes from, how it is calculated, three common ways to trade it, how it compares with Bollinger Bands, which settings to use, and how to load it on Titan FX MT5.
- The most common modern setting uses a 20-period EMA as the middle line, with bands at plus and minus 2 times the 10-period ATR
- The slope of the middle line shows the trend; the bands mark the normal range of recent price swings
- Three common strategies: buying pullbacks to the middle line in a trend, trading closes outside the channel, and fading the bands in a range
- When Bollinger Bands move inside the Keltner Channel, volatility has contracted; it may expand next, but a breakout is needed to confirm direction
- Titan FX MT5 ships with the Keltner Channel in the Navigator's Free Indicators folder
1. What Is the Keltner Channel?
The Keltner Channel first appeared in Chester Keltner's 1960 book, How to Make Money in Commodities. The original version used a 10-day average of the typical price (the average of the high, low and close) as the middle line, with the 10-day average daily range added and subtracted to form the bands.
In the 1980s, trader Linda Bradford Raschke introduced a newer version that uses an EMA for the middle line and ATR for the channel width. Most trading platforms today use this newer version.
The Keltner Channel has three lines:
| Line | What it shows |
|---|---|
| Middle line | Trend direction |
| Upper band | Top of the normal recent range |
| Lower band | Bottom of the normal recent range |
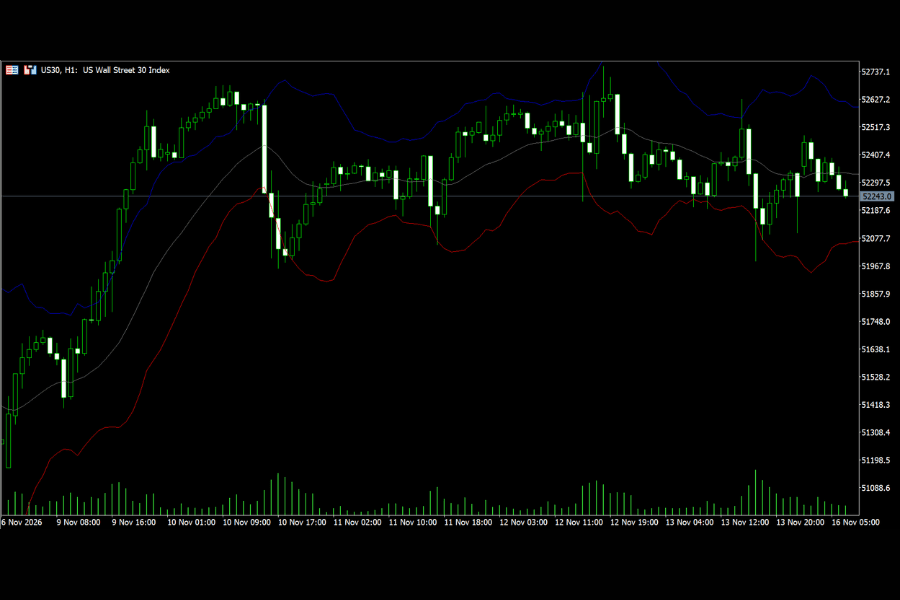
A rising middle line points to an uptrend and a falling one to a downtrend. The distance between the bands shows how volatile the market currently is.
2. Keltner Channel Formula
With the most common settings:
- Middle line = 20-period EMA
- Upper band = 20-period EMA + 2 × ATR(10)
- Lower band = 20-period EMA − 2 × ATR(10)
The average true range (ATR) starts with each bar's true range and then averages it over a set period. True range looks at the previous close as well as the high and low, so it captures price gaps. When volatility rises, ATR increases and the channel widens; when volatility falls, ATR drops and the channel narrows.
Example: A currency pair has a 20-period EMA of 1.1000 and a 10-period ATR of 0.0020
Upper band: 1.1000 + 2 × 0.0020 = 1.1040
Lower band: 1.1000 − 2 × 0.0020 = 1.0960
An EMA reacts to recent prices faster than a simple moving average (SMA), so the Keltner middle line stays closer to the current price. For the basics, see What Is a Moving Average?. Platforms and custom indicators can differ slightly, for example in whether the middle line uses the close or the typical price, so check the indicator's description and settings after loading it.
3. How to Use the Keltner Channel: Three Strategies
Strategy 1: Buy Pullbacks to the Middle Line in a Trend
Conditions: The middle line slopes upward and price spends most of its time between the middle line and the upper band, signaling an uptrend.
Entry: When price pulls back to the middle line, wait for a bar that shows buyers stepping in, such as a long lower wick or a bullish engulfing candle, before going long. Avoid buying the moment price touches the line.
Stop loss and invalidation: Base the stop on price structure, such as the last swing low, and on the risk you can accept. The lower band is a reference point, not a required stop level. A close below the lower band, or a middle line that flattens or turns down, invalidates the setup.
Downtrends work the other way around: when the middle line slopes down and a rally stalls near it, consider selling. You can also combine this with the trendlines of a price channel.
Strategy 2: Trade Closes Outside the Channel
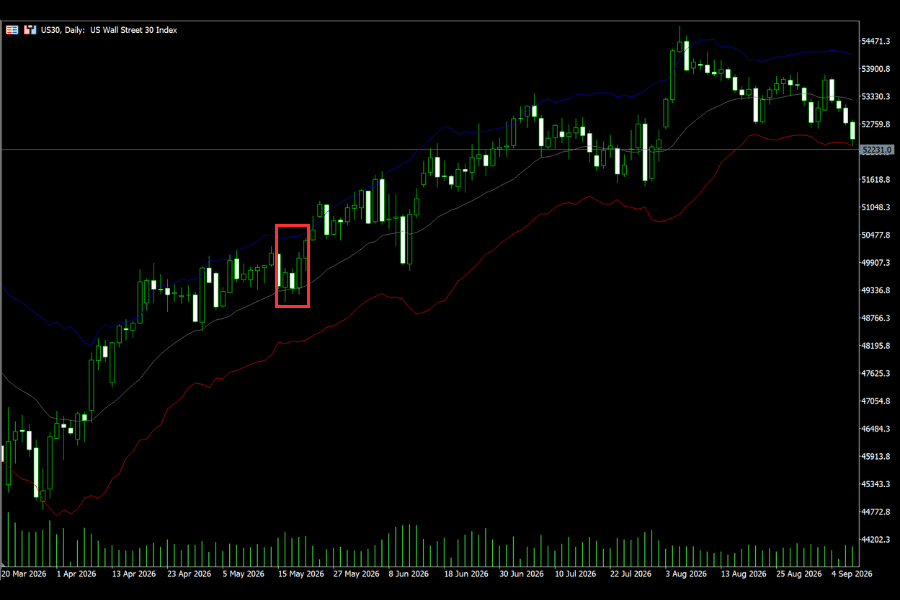
Conditions: A close above the upper band means price has moved beyond its normal recent range and is often read as a sign of strength; a close below the lower band signals weakness.
Entry: Wait for the close and check that the middle line points the same way, so you only trade breakouts in the direction of the trend.
Stop loss and invalidation: One approach is to place the stop on the other side of the consolidation before the breakout. If price quickly falls back inside the channel, it may be a false breakout. For the full approach, see Breakout Trading Strategy.
Strategy 3: Fade the Bands in a Range
Conditions: The middle line is flat and price swings between the bands without riding either one, signaling a range.
Entry: Treat the upper band area as resistance and the lower band area as support, and trade against the move once a reversal bar appears.
Stop loss and invalidation: Place the stop a reasonable distance outside the channel. If the middle line starts to slope or price keeps closing outside the channel, the range may be over, so stop fading the bands.
4. Keltner Channel vs. Bollinger Bands
| Keltner Channel | Bollinger Bands | |
|---|---|---|
| Middle line | EMA | Usually SMA |
| Width based on | ATR | Standard deviation |
| Width changes | Usually smoother | More sensitive |
Bollinger Bands use standard deviation, so they widen quickly when price moves sharply. Keltner Channels use ATR, so their width changes more gradually.
Using Both: The Volatility Squeeze
Put both indicators on the same chart. When the upper and lower Bollinger Bands move inside the Keltner Channel, recent volatility has dropped sharply. The well-known TTM Squeeze indicator is based on this idea.
A squeeze shows that the market is in a relatively quiet phase, and volatility may expand afterward. It does not tell you the direction or size of the next move, though. Wait for price to break out and confirm the direction with the trend.
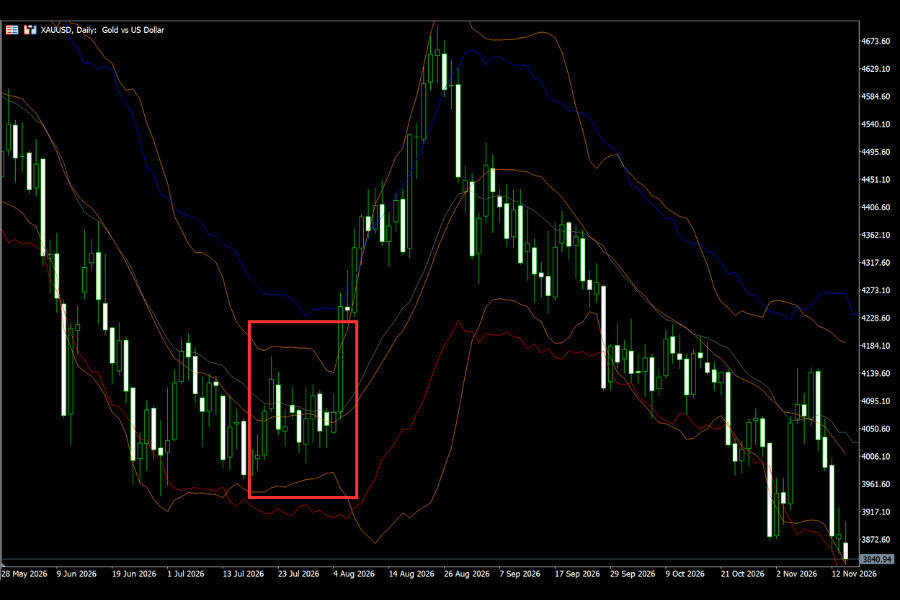
The chart above shows gold (XAUUSD) on the daily timeframe. The blue and red lines are the Keltner Channel's upper and lower bands, and the orange lines are the Bollinger Bands. From mid-July to early August 2026, the Bollinger Bands stayed inside the Keltner Channel; price then broke higher and volatility expanded sharply.
5. Best Keltner Channel Settings
| Setting | Common value | Effect of changing it |
|---|---|---|
| EMA period | 20 | Longer is smoother but slower |
| ATR period | 10 | Shorter is more sensitive |
| ATR multiplier | 2 | Larger means wider bands, fewer breaks |
A larger multiplier makes it harder for price to break the channel, so signals become less frequent; a smaller one produces more signals but also more noise. EMA 20, ATR 10 and a multiplier of 2 are common settings, not the only correct ones, and default values can differ between platforms, so check the settings after loading the indicator. On Titan FX MT5, the bundled Keltner Channel defaults to EMA 20, ATR 10 and a multiplier of 2.0.
Short-term traders often shorten the EMA period, for example to 10, while medium- to long-term traders can use the defaults on the daily chart. There is no single right answer, so test the settings on historical charts for the instruments and timeframes you trade.
6. Limitations and Risks
-
Price can ride the bands in a trend: In a strong rally, price may hug the upper band for a long time. Selling near the upper band then means trading against the trend
-
Touching a band is not overbought or oversold: A touch of the upper band only means price has moved beyond its normal recent range; it does not mean a reversal is coming. The same applies to the lower band
-
Channel width is not a stop distance: ATR reflects past volatility and does not guarantee price will stay inside the channel. Set stops using recent highs and lows, support and resistance, and your risk per trade
-
Breakouts can fail: An intraday poke through a band is not always meaningful. Waiting for the close and trading in the direction of the trend helps filter false signals
-
The indicator lags: Both the EMA and ATR are calculated from past prices, so the channel reacts more slowly than price. Around major news, price can jump straight out of the channel
-
Confirm with other tools: Use multi-timeframe analysis to check the trend on a higher timeframe, then use the channel on a lower timeframe to time entries
7. How to Add the Keltner Channel in MT5
The Keltner Channel is not one of MT5's standard built-in indicators, so you will not find it under Insert → Indicators. Titan FX MT5 ships with it, so there is nothing extra to install.
-
① Open the Navigator: Press Ctrl+N to open the Navigator panel
-
② Find the indicator: Expand Indicators → Free Indicators and locate Keltner Channel
-
③ Apply it to the chart: Double-click it or drag it onto the chart, check the settings on the Inputs tab and click OK. Period of EMA sets the EMA period, Period of ATR the ATR period, ATR multiplier the multiplier, and Show price of level whether the band prices are displayed
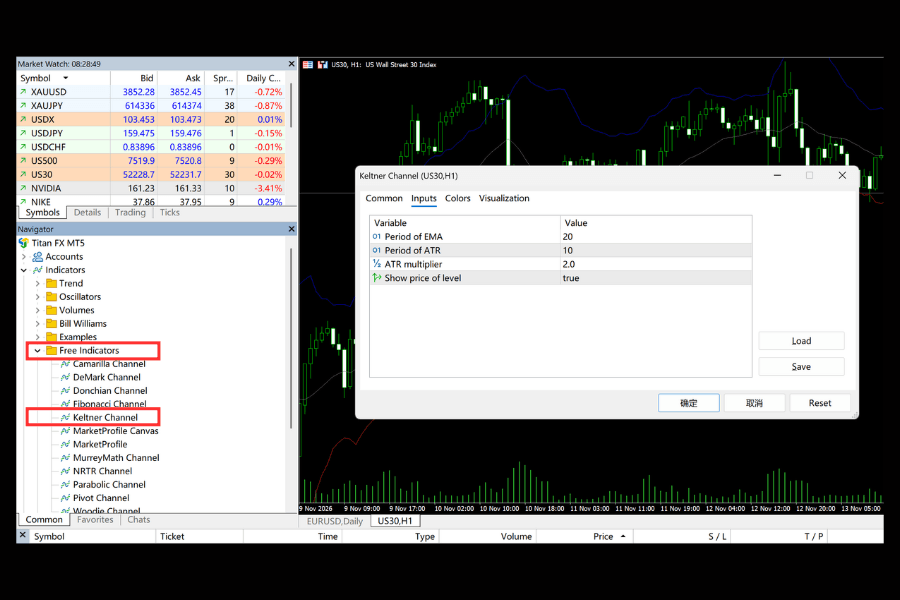
The same Free Indicators folder includes other channel indicators such as the Donchian Channel. If your platform does not include the Keltner Channel, you can download it from the official MQL5 Code Base; do not install files from unknown sources.
Titan FX also offers a range of free custom indicators.
View All Custom Indicators8. FAQ
Q1. What are the best Keltner Channel settings?
The most common settings are EMA 20, ATR 10 and a multiplier of 2. Shorten the EMA period for short-term trading, or raise the multiplier if you want fewer signals. Test any change on historical charts first.
Q2. Which is better, Keltner Channels or Bollinger Bands?
They serve different purposes. Keltner Channels use ATR and produce smoother bands that suit trend and breakout trading; Bollinger Bands use standard deviation and respond more to changes in volatility. Used together, they help you spot volatility squeezes.
Q3. Should I sell when price touches the upper band?
Not necessarily. In a range, the upper band can act as resistance, but in an uptrend price can keep climbing along the upper band. Check the slope of the middle line first to tell whether the market is trending or ranging.
Q4. Why can't I find the Keltner Channel in MT5?
Because it is not one of MT5's standard built-in indicators. On Titan FX MT5, you can load it from Navigator → Indicators → Free Indicators → Keltner Channel.
Q5. Does a break outside the Keltner Channel mean a new trend has started?
Not always. A close outside the channel means price has moved beyond its normal recent range, but it can still be a false breakout. Confirm it with the slope of the middle line, price structure and other timeframes rather than relying on a single break.
Q6. Which markets and timeframes suit the Keltner Channel?
It works on liquid markets such as forex, gold and stock indices. The shorter the timeframe, the more noise and false breakouts you will see; signals on the daily and 4-hour charts tend to be more reliable.
9. Conclusion
The Keltner Channel draws bands a multiple of ATR above and below an EMA to show trend direction, the normal range of price swings and breakouts. The slope of the middle line tells you whether to trade with the trend or fade the range, and closes outside the channel can signal strength or weakness.
Combined with Bollinger Bands, it also helps you spot volatility squeezes. Because the indicator lags and price can ride the bands in a trend, use it together with trend analysis and a stop loss.
Further Reading
The financial markets research team at Titan FX. We produce educational content across a broad range of instruments, including forex (FX), commodities (crude oil, precious metals, agricultural products), equity indices, U.S. stocks, and crypto assets.
Primary Sources
- Indicator definition and history: StockCharts ChartSchool, "Keltner Channels" and "TTM Squeeze" (Chester Keltner's 1960 original, Linda Bradford Raschke's EMA and ATR version, default settings of EMA 20, ATR 10 and multiplier 2)
- Platform: Titan FX MT5 "Free Indicators" pack