Technical Analysis: Tools, Indicators & Strategies Explained
Technical analysis is a vital tool in financial markets, empowering investors to identify trading opportunities from price movements. Whether you're a beginner in stocks, forex, commodities, or cryptocurrencies, mastering technical analysis sharpens your strategy.
This guide covers core concepts, key indicators, practical examples, and pitfalls, highlighting Titan FX’s robust tools to help you excel in learning and trading.
1. What Is Technical Analysis?
Technical analysis is a method of forecasting future price movements using historical prices, trading volume, and chart patterns. It rests on three core assumptions:
- Prices reflect all information: Markets incorporate economic data, news, and more.
- Prices move in trends: Uptrends, downtrends, or consolidation follow patterns.
- History repeats: Price patterns tie to investor psychology.
Unlike fundamental analysis, which focuses on financial statements or economic metrics, technical analysis prioritizes "price action" to pinpoint entry and exit points via charts and indicators.
It suits short-term trading (e.g., forex scalping) and long-term investing (e.g., stock portfolios), making it versatile across markets.
For instance, forex traders might use it to gauge EUR/USD trends, while stock investors analyze support levels for individual equities. Regardless of the market, technical analysis offers a decision-making edge.
Extended Reading:
2. Technical Analysis Basics for Beginners
Candlestick Charts: The Starting Point
Candlestick charts are the cornerstone of technical analysis, with each candlestick capturing four data points:
- Open: Price at the start of the period.
- Close: Price at the period’s end.
- High: Highest price in the period.
- Low: Lowest price in the period.

Common Patterns:
- Bullish Candle: Close above open, signaling buyer strength.
- Bearish Candle: Close below open, indicating selling pressure.
- Doji: Open and close nearly equal, reflecting market indecision.
For example, a tall bullish candle with high volume may signal an uptrend, while a "gravestone doji" with a long upper shadow could hint at a reversal. Beginners should start with daily charts to learn single and multi-candle patterns.
Learn More About Candlestick Patterns
Support and Resistance: Key Price Levels
- Support: A price zone where declines often halt, as buyers step in. For example, a stock repeatedly bounces at $50.
- Resistance: A level where rallies stall due to selling pressure, such as $60.
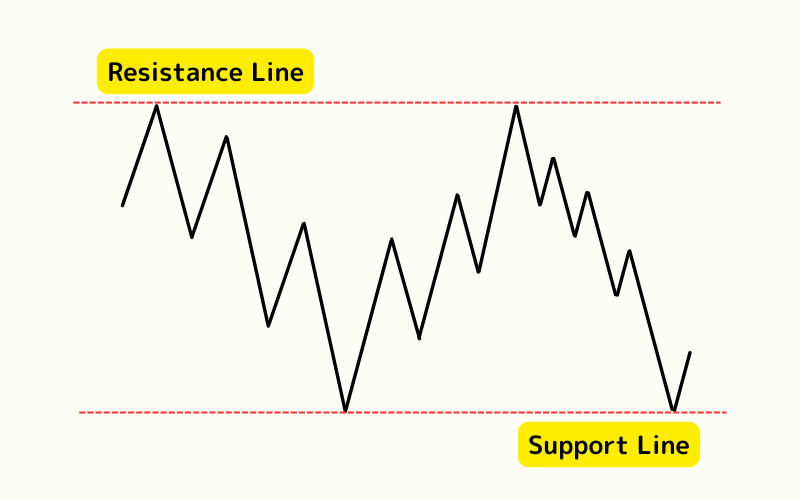
Practical Use: A breakout above resistance, if sustained, may turn it into new support, signaling a buy opportunity. A breakdown below support suggests further declines, ideal for setting stop-losses.
What Are Support and Resistance Lines?
Trendlines: Mapping Direction
By connecting price lows (uptrend) or highs (downtrend), trendlines reveal market direction. A break of a trendline often signals a reversal or acceleration.
3. Types and Uses of Technical Indicators
Technical indicators are the backbone of technical analysis, leveraging charts and data to predict future price movements. These tools, derived from historical prices and volume, help traders identify trends, overbought/oversold conditions, or trading signals.
Indicators fall into three main categories:
Below, we explore each category’s features and practical applications.
3.1 Trend Indicators
Trend indicators focus on identifying market direction, helping traders determine if prices are rising, falling, or consolidating. Common trend indicators include:
Moving Average (MA)
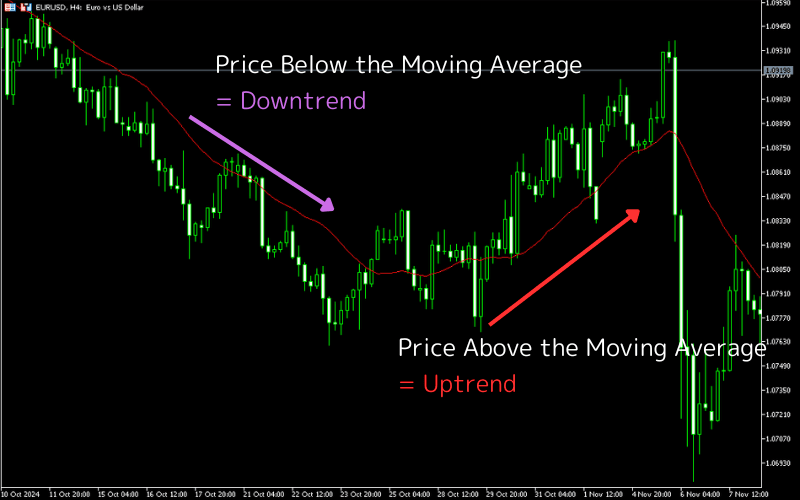
Moving Average smooths price fluctuations to reveal the dominant trend. By averaging closing prices over a set period, it clarifies market direction.
Common types include Simple Moving Average (SMA), Exponential Moving Average (EMA), and Weighted Moving Average (WMA), each suited to different strategies based on weighting methods.
Traders monitor the slope and crossovers, such as a Golden Cross (short-term MA crossing above long-term MA, a buy signal) or a Death Cross (short-term MA crossing below, a sell signal).
Bollinger Bands
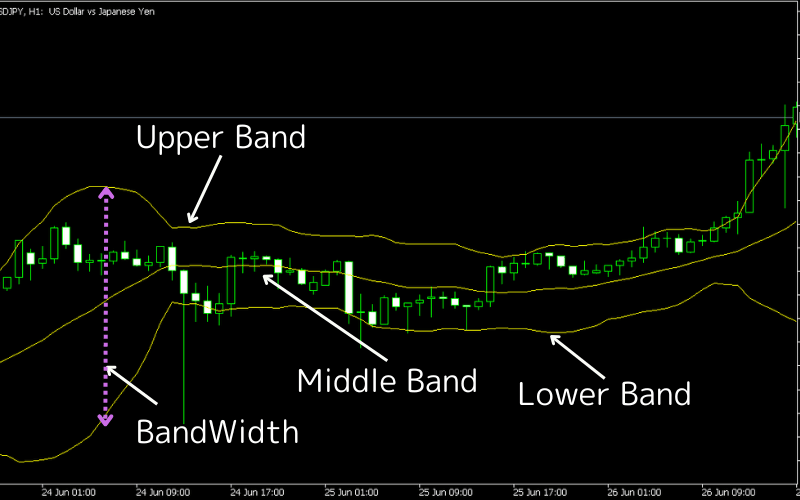
Bollinger Bands, developed by John Bollinger, are volatility-based indicators. They consist of a 20-day SMA (middle band) flanked by upper and lower bands set two standard deviations away, reflecting price ranges and extremes.
Prices near the upper band suggest overbought conditions, while those near the lower band indicate oversold states. A band squeeze (narrowing) signals an impending big move, while expansion confirms trend continuation.
A breakout above the upper band with rising volume may warrant a buy; a drop below the lower band could signal a sell.
Ichimoku Cloud
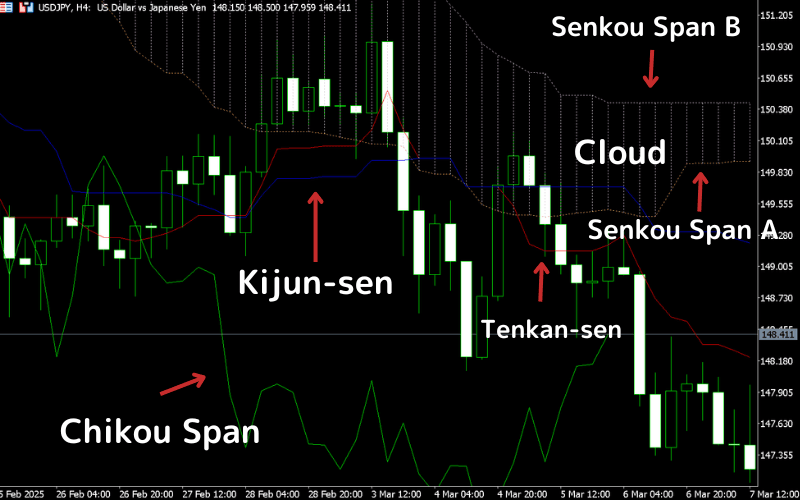
The Ichimoku Cloud comprises five lines: Tenkan-sen (Conversion Line), Kijun-sen (Base Line), Senkou Span A, Senkou Span B, and Chikou Span (Lagging Line). The area between Senkou Span A and B forms the "cloud," a key support/resistance zone.
Except for the lagging line, lines are calculated as midpoints of highs and lows over specific periods, signaling market trends. Prices above the cloud indicate an uptrend, below suggest a downtrend. A Tenkan-sen crossing above Kijun-sen is a buy signal, and vice versa.
DMI (Directional Movement Index)
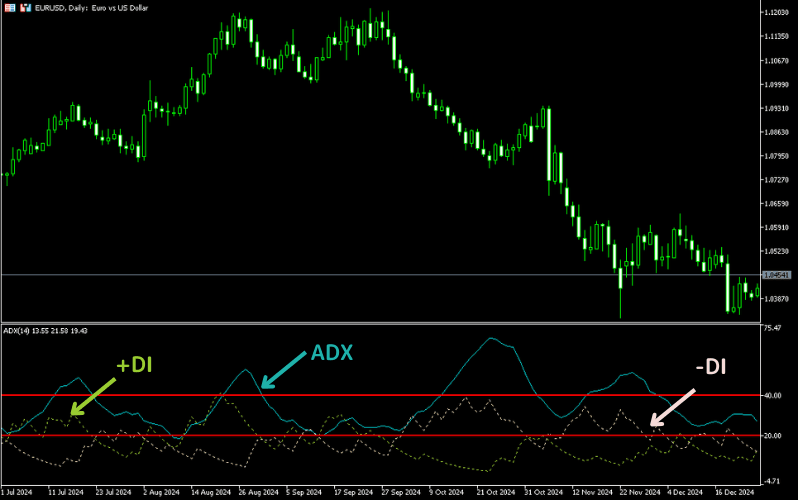
DMI includes +DI (positive directional indicator), -DI (negative directional indicator), and ADX (average directional index) to gauge trend strength and direction, addressing limitations of oscillators like RSI in trending markets.
A +DI above -DI signals an uptrend, with rising ADX confirming strength. Conversely, -DI dominance indicates a downtrend. A +DI crossing above -DI with rising ADX is a buy signal; -DI crossing above +DI suggests a sell.
Parabolic SAR
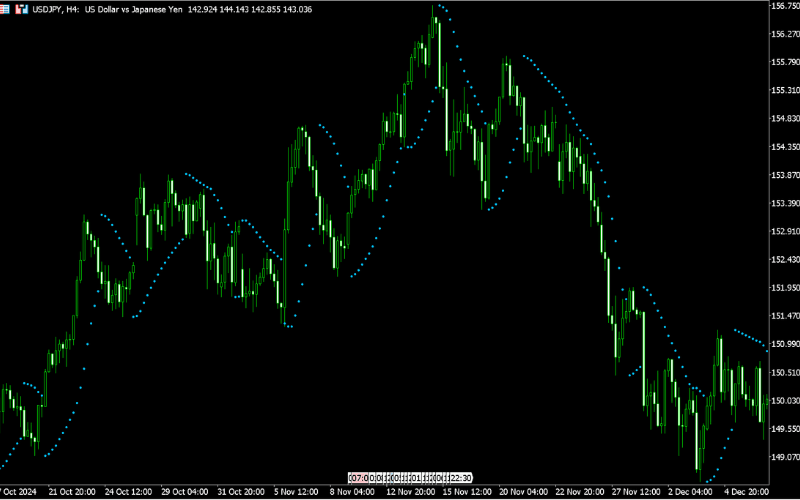
Developed by J. Welles Wilder, the Parabolic SAR (Stop and Reverse) tracks trends and potential reversals. Displayed as dots above or below price, dots below candles signal an uptrend, above indicate a downtrend. A price crossing the SAR dot flips the indicator, hinting at a reversal.
Dots nearing prices suggest weakening trends; wider gaps imply strength. A shift from below to above with a price drop below SAR may prompt a sell; a shift from above to below with a breakout suggests a buy.
Standard Deviation
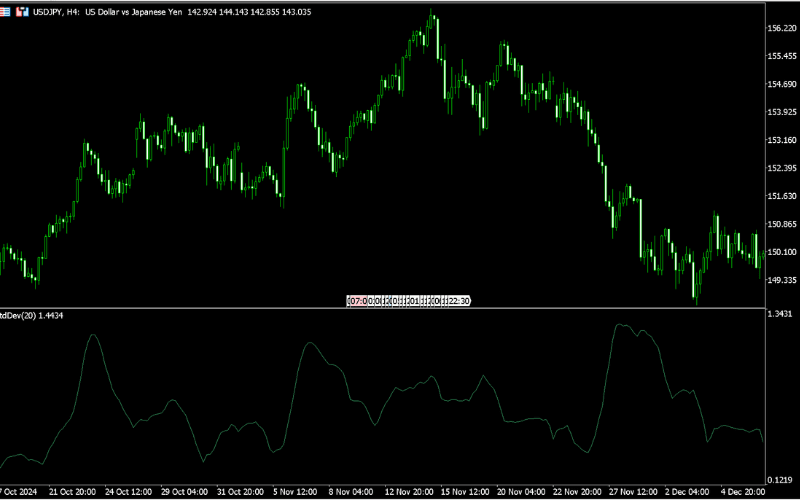
Standard Deviation measures price volatility relative to a moving average, quantifying market fluctuations. Using a 20-day period, higher values indicate greater volatility, lower values suggest stability. Plotted as a single line, it pairs well with tools like Bollinger Bands.
High standard deviation flags volatile markets, potentially signaling reversals or breakouts; low values point to consolidation. A rising standard deviation with a price breakout above a moving average may justify a buy; a high-to-low drop warns of pullback risks.
3.2 Oscillator Indicators
Oscillator Indicators assess overbought or oversold conditions, excelling in range-bound markets. Key oscillators include:
RSI (Relative Strength Index)
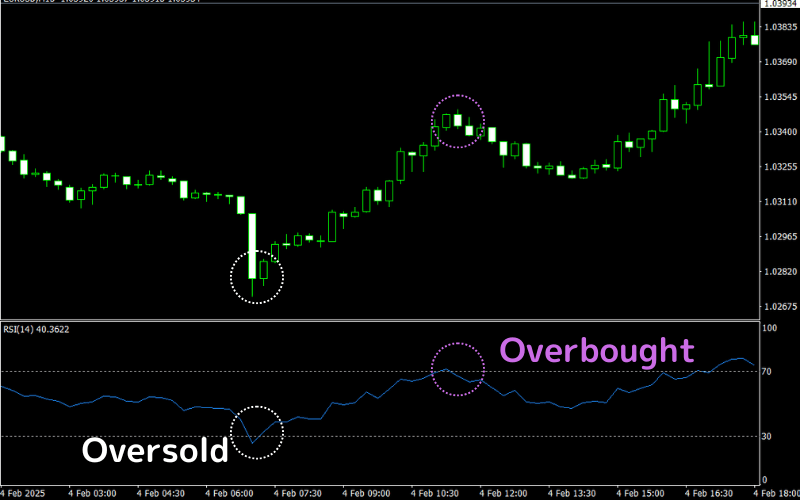
RSI is a widely used oscillator measuring overbought/oversold states by comparing average gains to losses over a period, spotting potential reversals.
RSI > 70: Overbought, suggesting a pullback or decline; consider selling or reducing positions.
RSI < 30: Oversold, hinting at a rebound or rise; consider buying or adding positions.
RSI Divergence: If prices hit new highs but RSI doesn’t, it may signal a reversal.
MACD (Moving Average Convergence Divergence)
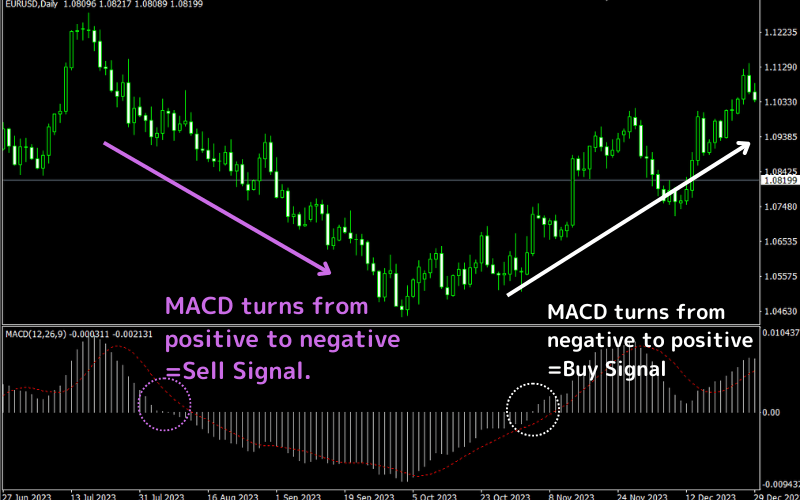
MACD blends trend and oscillator traits to gauge trend strength and reversals. On MT4/MT5, it’s shown as a histogram and signal line (default omits the MACD line itself).
| Crossover Type | Description |
|---|---|
| Golden Cross | When the MACD histogram shifts from negative to positive, indicating the MACD line (fast) crossing above the signal line (slow). Seen as a buy signal, suggesting rising momentum and potential price increases. |
| Death Cross | When the MACD histogram shifts from positive to negative, indicating the MACD line crossing below the signal line. Seen as a sell signal, suggesting weakening momentum and potential price declines. |
CCI (Commodity Channel Index)
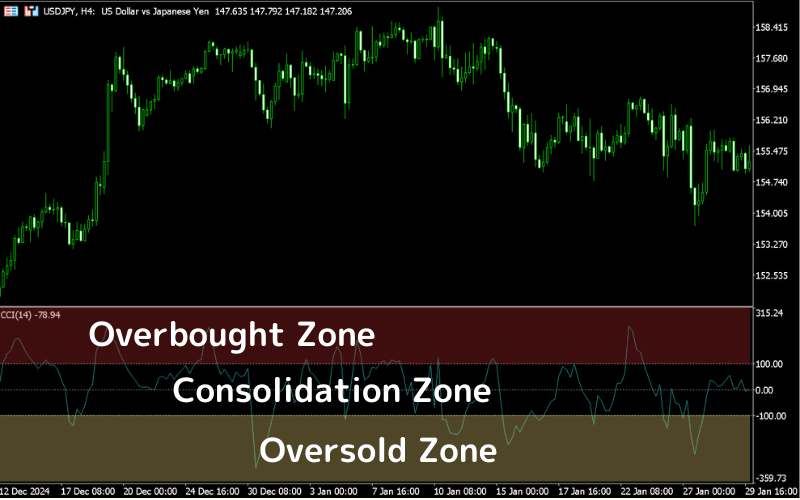
CCI measures price deviation from its statistical mean, identifying overbought/oversold states and reversal signals. It uses a 14-period default but is adjustable.
| Signal Type | Description |
|---|---|
| CCI > +100 | Overbought, suggesting a pullback or decline; consider selling or reducing positions. |
| CCI < -100 | Oversold, hinting at a rebound or rise; consider buying or adding positions. |
| CCI Zero Cross | CCI rising above zero from negative signals a buy; falling below zero from positive signals a sell. |
Stochastic Oscillator (KD)
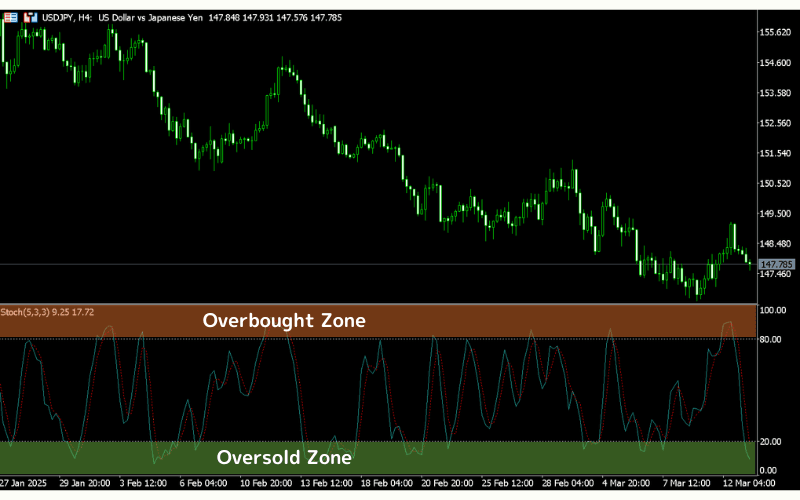
Stochastic Oscillator gauges overbought/oversold states by comparing current prices to a recent price range, predicting reversals. It features %K (price position) and %D (smoothed %K) lines.
| Signal Type | Description |
|---|---|
| %K > 80 | Overbought, suggesting a pullback or decline; consider selling or reducing positions. |
| %K < 20 | Oversold, hinting at a rebound or rise; consider buying or adding positions. |
| %K-%D Crossover | %K crossing above %D signals a buy; crossing below signals a sell. |
Psychological Line (PSY)
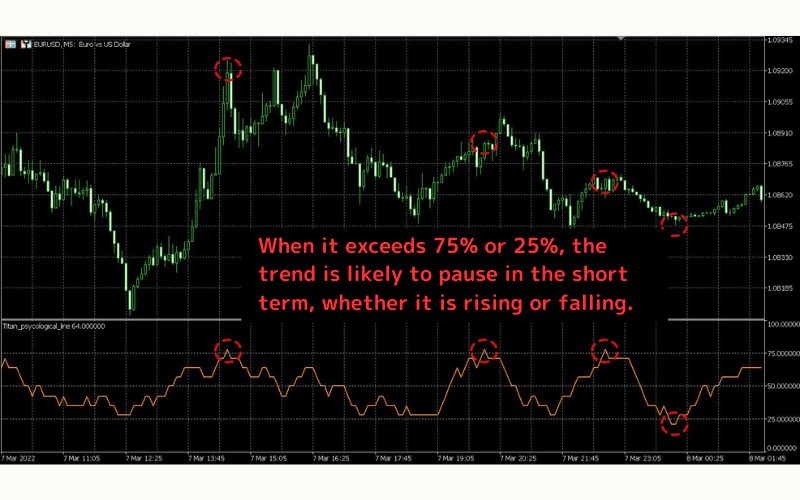
Psychological Line (PSY) is a simple oscillator showing the percentage of up candles in a set period, gauging market sentiment.
A PSY of 100% means all candles were bullish; 0% means all bearish. It helps spot overheated or oversold markets.
| Signal Type | Description |
|---|---|
| PSY > 75 | Overly optimistic market, possibly overheated; consider selling or reducing positions. |
| PSY < 25 | Overly pessimistic market, potentially due for a rebound; consider buying or adding positions. |
| PSY Extremes | Near 100 or 0 signals extreme sentiment, cautioning possible reversals. |
3.3 Other Indicators
These indicators supplement trend and oscillator tools, offering deeper market insights. Common examples include:
Volume
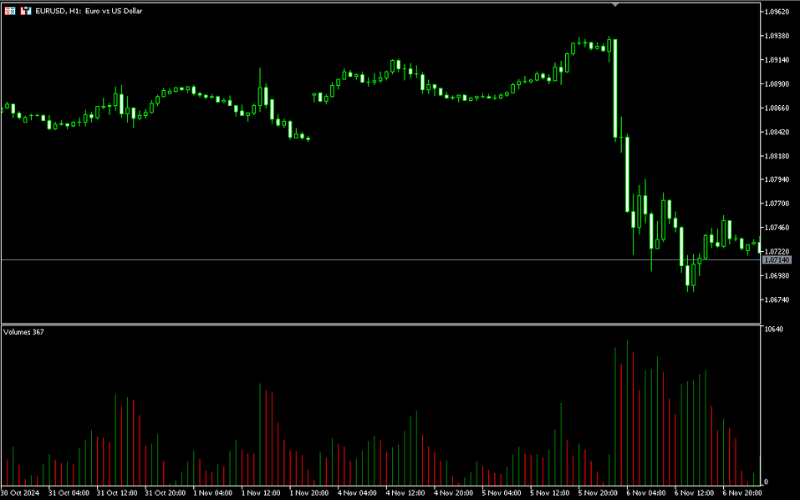
Volume reflects trading activity, showing buy/sell intensity over time. Displayed as bars below price charts, taller bars indicate higher activity, shorter ones suggest quiet markets.
Rising prices with surging volume signal strong buying, supporting a buy; rising prices with low volume may indicate a false breakout, urging caution. Falling prices with high volume confirm selling pressure, favoring a sell or hold.
OBV (On-Balance Volume)
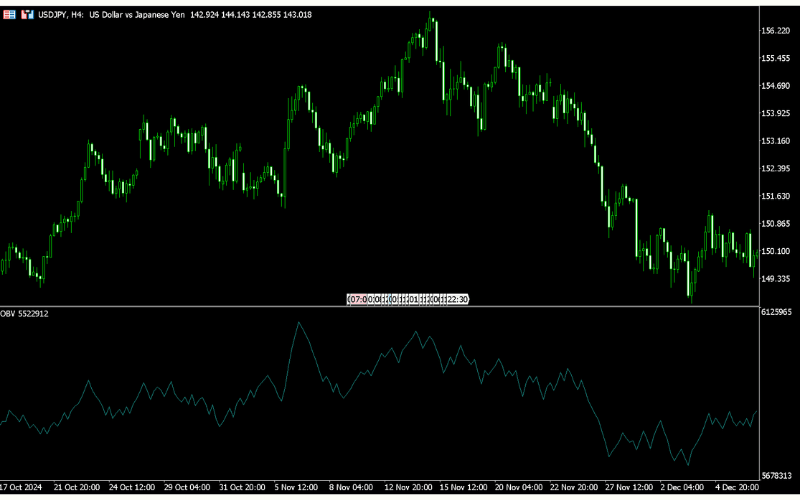
Developed by Joseph Granville, OBV tracks capital flow by linking volume to price direction. Volume is added to OBV on up days, subtracted on down days. Rising OBV signals buying dominance, falling OBV shows selling pressure.
Divergence (e.g., price hits a new high but OBV doesn’t) may predict reversals. A rising OBV with a price breakout above resistance is a buy signal; a falling OBV during consolidation warns of sell-off risks.
Alligator
The Alligator uses three smoothed moving averages—Jaw (blue), Teeth (red), and Lips (green)—to mimic alligator behavior, signaling trend starts and ends.
- Jaw: 13-period MA, shifted 8 periods, for long-term trends.
- Teeth: 8-period MA, shifted 5 periods, for mid-term trends.
- Lips: 5-period MA, shifted 3 periods, for short-term trends.
Lines spreading upward (Lips > Teeth > Jaw) signal an uptrend, favoring buys; downward (Jaw > Teeth > Lips) signals a downtrend, favoring sells. Tangled lines suggest consolidation, advising a wait. A Lips crossover above Teeth and Jaw with rising volume supports a buy.
Fractal
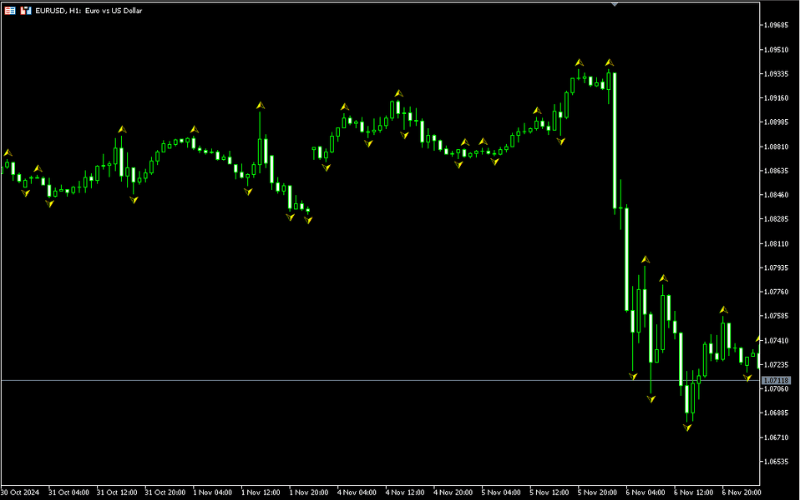
Fractals identify local highs/lows on charts, marking support/resistance levels. Using five candles, they flag the middle candle as a peak (upper fractal, up arrow) or trough (lower fractal, down arrow).
Upper fractals signal resistance, lower ones support. They aid in drawing trendlines or spotting breakouts. A price breakout above an upper fractal with strong volume suggests a buy; a drop below a lower fractal may signal a sell. Pairing with MAs or RSI boosts accuracy.
4. Real-World Trading Examples
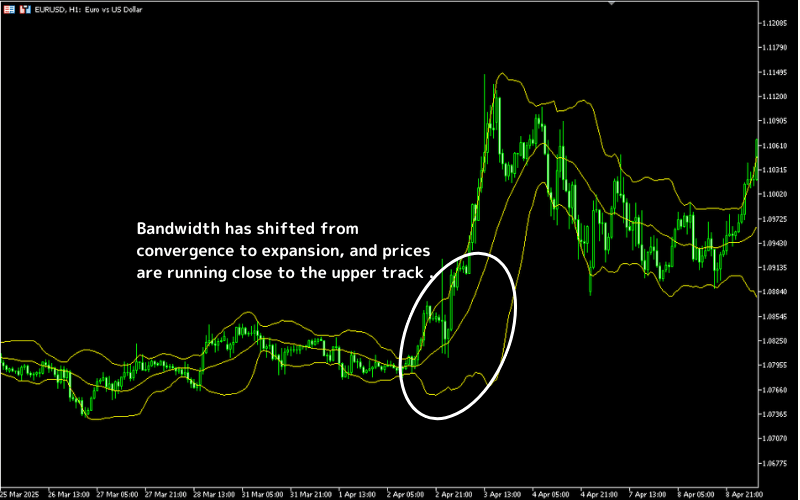
Example 1: Using Bollinger Bands Alone
As shown in the chart, Bollinger Bands shift from contraction to expansion, with prices hugging the upper band. This signals strong bullish momentum, confirming an uptrend.
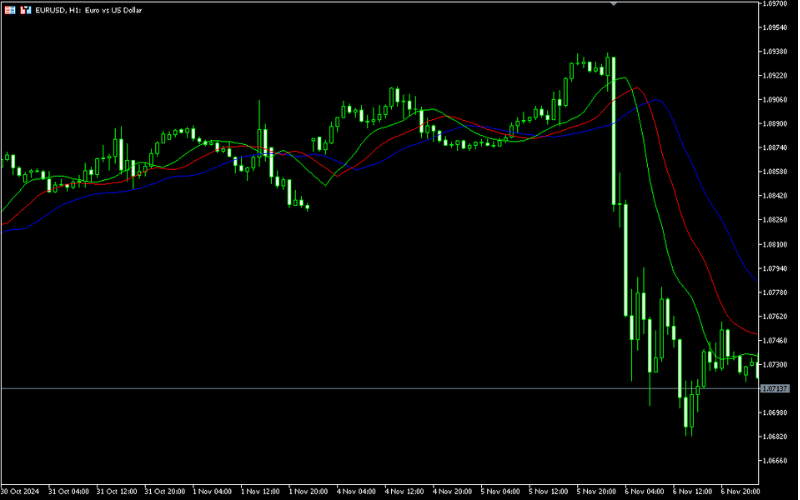
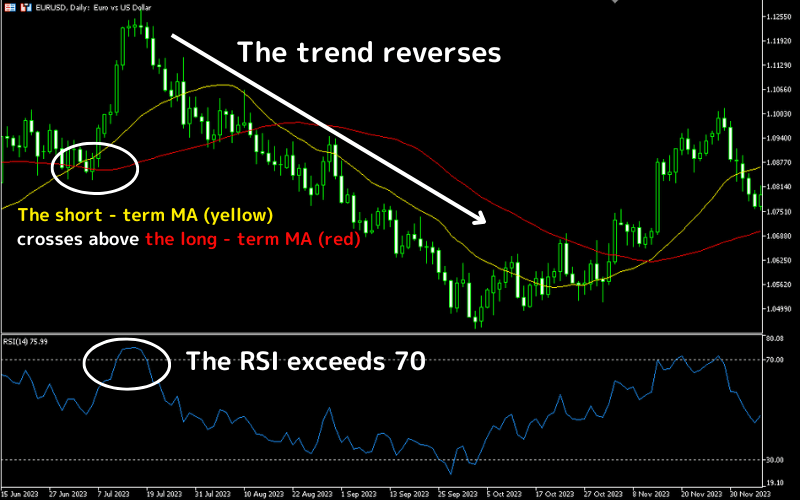
Example 2: Combining MA and RSI
In the chart, a short-term moving average crosses above a long-term one, while RSI surges past 70, indicating robust bullish momentum and an accelerating rally. However, after entering overbought territory, prices reverse sharply, forming a topping signal with a notable pullback.
5. Titan FX’s Technical Analysis Tools and Services
Titan FX offers a suite of professional, customizable indicators to help traders better navigate market trends and sharpen decisions.
Developed by experts, these tools suit forex, metals, indices, and more, blending high visualization with deep analytics.
Below is a selection of indicators; click the link for the full list.
| Name | Description | Link |
|---|---|---|
| Titan_RR_Assist | Confirms risk-reward ratios | View |
| Titan_ZigZag_Trend | Draws trendlines using ZigZag | View |
| Titan_Set_Timeframe_ZigZag | Displays multiple ZigZag lines | View |
| Titan_MA_Trend | Shows MA slope via chart background color | View |
| Titan_Change_Symbol | Changes asset names on charts | View |
| Titan_Set_Timeframe_Stochastics | Shows Stochastic across multiple timeframes | View |
| Titan_Heikinashi_checker | Displays up to 5 timeframe Heikin Ashi states | View |
| Titan_Chart_Draw | Plots candlestick charts in sub-windows | View |
| Titan_Time_Range | Boxes high/low prices in set periods | View |
| Titan_Comparison | Shows ratio/difference of two assets | View |
| Titan_ADX_Range | Alerts on ADX-based range/breakout zones | View |
| Titan_3RSI | Displays three RSI lines | View |
| Titan_SR_line | Highlights potential support/resistance lines | View |
| Titan_perfectorder_RCI | Shows three RCI alignments and slopes | View |
| Titan_Lot_Size_Calculator | Auto-adjusts order size based on loss/stop levels for market orders | View |
| Titan_Profit_Loss | Shows breakeven and liquidation levels on charts | View |
6. Technical Analysis FAQ
Q1: Is Technical Analysis Suitable for Beginners?
Yes. Candlesticks and moving averages (MA) are straightforward, making them ideal starting points. Begin with trend and momentum indicators, then explore advanced tools.
Q2: Which Indicators Are Common, and How Do I Choose?
No single indicator is "best"; combining them is key.
- Trending Markets: Use MA, MACD.
- Range-Bound Markets: Try RSI, Bollinger Bands.
Pair with volume and multi-timeframe analysis to boost accuracy and avoid signal failures.
Q3: What Is Divergence, and How Do I Spot It?
Divergence occurs when price and indicator trends conflict, such as:
- Bearish Divergence: Price hits a new high, RSI doesn’t → potential decline.
- Bullish Divergence: Price hits a new low, RSI doesn’t → potential rebound.
Confirm with volume and support/resistance zones to reduce misreads.
Learn More: What Is Divergence?
Q4: Does Technical Analysis Have Risks, and Can It Guarantee Profits?
Technical analysis doesn’t guarantee profits; it improves odds. Risks include:
- False or lagging signals.
- Misusing indicators (e.g., MA in choppy markets).
- Misreading divergence or overtrading.
Always pair with risk management, disciplined execution, and clear strategies.
7. Conclusion
Technical analysis equips traders to navigate markets using candlesticks, support/resistance, trendlines, and indicators. Moving averages reveal trend direction, RSI gauges momentum, MACD spots reversals, and Bollinger Bands measure volatility—each tool fits specific scenarios.
Beginners should start with candlesticks and MAs, practicing on Titan FX’s MT4/MT5 platforms to bridge theory and execution.