

What Are Harmonic Patterns? XABCD, the PRZ and the Ratios and Trading Rules of the Gartley, Bat, Butterfly and Crab
Harmonic patterns are a family of price structures defined by Fibonacci ratios. Each is built from five turning points — X, A, B, C and D — and is used to project the zone where price is most likely to reverse. The Gartley, Bat, Butterfly and Crab are all versions of the same XABCD structure with different ratio sets; what separates them is how deep point B retraces and where point D finally lands. The AB=CD is the four-point building block, and most XABCD patterns use it as one of the projections for point D.
Ordinary chart patterns are recognized by shape; harmonic patterns are measured. Each leg has to fit a specific Fibonacci ratio, and the price area where several ratios point to the same level is the "Potential Reversal Zone" (PRZ). That lets you calculate the entry, stop-loss and target ahead of time, more so than with most patterns.
The trade-off is a fiddlier identification process and the need to decide your own tolerance for the ratios.
This article covers what harmonic patterns are and where they came from, the XABCD structure they share and the Potential Reversal Zone, the ratios of the five most common patterns, how to measure and identify them on a chart, how to set the entry, stop-loss and targets, and their limits and common mistakes.
- A harmonic pattern has five turning points: X, A, B, C and D. XA is the initial leg, AB, BC and CD alternate between retracement and extension, and D is where the reversal is expected
- Two ratios tell the patterns apart: how far B retraces XA, and where D sits relative to XA. In the Gartley and Bat, D stays inside X; in the Butterfly and Crab, D goes beyond X
- The Potential Reversal Zone (PRZ) is the price band near D where several Fibonacci retracements and extensions overlap, usually the projections from XA, BC and AB=CD. You trade the zone by waiting for confirmation of a reversal, not by entering the moment price touches D
- Stops go outside the PRZ (for the Gartley and Bat, usually beyond X). The first target is commonly the 0.382 retracement of AD, the second the 0.618
- Identification is partly subjective, so allow a small tolerance on the ratios and keep the same tolerance rule for the same strategy. Candlestick reversal signals, RSI divergence or support and resistance add confirmation and keep you from entering as soon as price reaches the PRZ
- 1. What Are Harmonic Patterns? Definition and Origin
- 2. Reading the XABCD Structure: Four Legs and the Potential Reversal Zone (PRZ)
- 3. The Four Main XABCD Patterns and AB=CD: Gartley, Bat, Butterfly and Crab
- 4. How to Draw Harmonic Patterns: Finding X, A, B, C and D with Fibonacci Tools
- 5. How to Trade Harmonic Patterns: Entry, Stop-Loss and Targets
- 6. Limits of Harmonic Patterns and Common Mistakes
- 7. Harmonic Patterns FAQ
- 8. Conclusion
1. What Are Harmonic Patterns? Definition and Origin
Harmonic patterns are reversal patterns whose conditions are Fibonacci ratios. Price first makes a leg from X to A, retraces to B, bounces to C and returns to D; the relative lengths of the four legs must fit specific ratios for D to count. Once the pattern completes, price is expected to run the other way from D. In a bullish pattern D is a low and a rise is expected; a bearish pattern is the mirror image.
The method began with the retracement pattern H.M. Gartley described in Profits in the Stock Market in 1935, later known as the Gartley pattern. The book contains no Fibonacci ratios.
In the 1990s Larry Pesavento added Fibonacci ratios to the structure, giving each leg a measurable standard. Scott Carney later cataloged the Bat, the Crab and others, assigned each its ratios, and coined the term "harmonic trading." Most of the ratios used on today's platforms and in textbooks follow that line of definitions.
What sets harmonic patterns apart from ordinary reversal patterns is that the conditions are numbers. A double top or head and shoulders is judged by its shape and neckline; a harmonic pattern requires B and D to land on specific ratios.
That is why the reversal zone can be calculated before price gets there, and why the patterns are used to plan entries and stops.
2. Reading the XABCD Structure: Four Legs and the Potential Reversal Zone (PRZ)
Every harmonic pattern shares the same skeleton. In a bullish pattern, X is the starting low, A the high after the first leg up, B the low of the pullback, C the high of the bounce, and D the low of the final decline — the expected reversal point. A bearish pattern flips every direction.
-
XA leg: the initial impulse. Every later ratio is measured against it.
-
AB leg: a retracement of XA. Its depth is the first clue to which pattern you are looking at; the common ratios are 0.382, 0.5, 0.618 and 0.786.
-
BC leg: a bounce against AB. Most patterns allow anything between 0.382 and 0.886.
-
CD leg: the final leg, usually an extension of 1.13 to 3.618 times BC. Its endpoint D must also fit a ratio relative to XA.
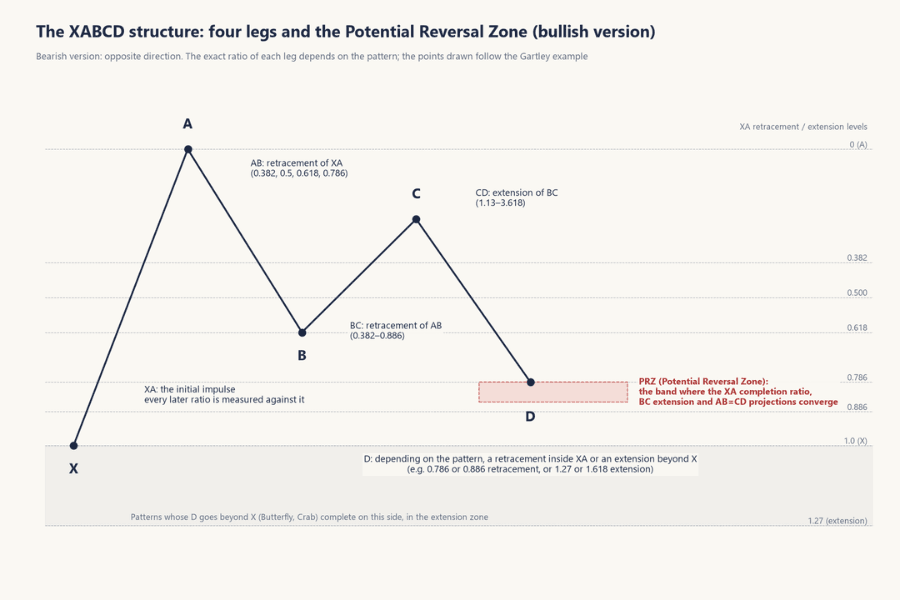
In practice, D is a band rather than a single price. Each Fibonacci projection the pattern calls for produces its own level; the usual ones are D's retracement or extension of XA, CD's extension of BC, and the equal-length AB=CD projection. Which combination applies varies a little from pattern to pattern.
The stretch of price where these levels overlap or cluster is the Potential Reversal Zone (PRZ). The closer the projections sit to one another, the tighter the PRZ, and harmonic traders generally regard that as a better structure — but a tight zone is no guarantee that price will reverse.
| Term | Meaning | Use |
|---|---|---|
| X, A, B, C, D | Five turning points in chronological order | Define the four legs |
| Retracement ratios | AB as a share of XA, BC as a share of AB | Identify the pattern |
| Extension ratios | CD as a multiple of BC, D as a multiple of XA | Project where D should land |
| Potential Reversal Zone (PRZ) | The price band where several Fibonacci projections overlap | Reference for planning entries and stops |
3. The Four Main XABCD Patterns and AB=CD: Gartley, Bat, Butterfly and Crab
The common harmonic structures fall into four main XABCD patterns plus the AB=CD, which underpins the projections for most of them.
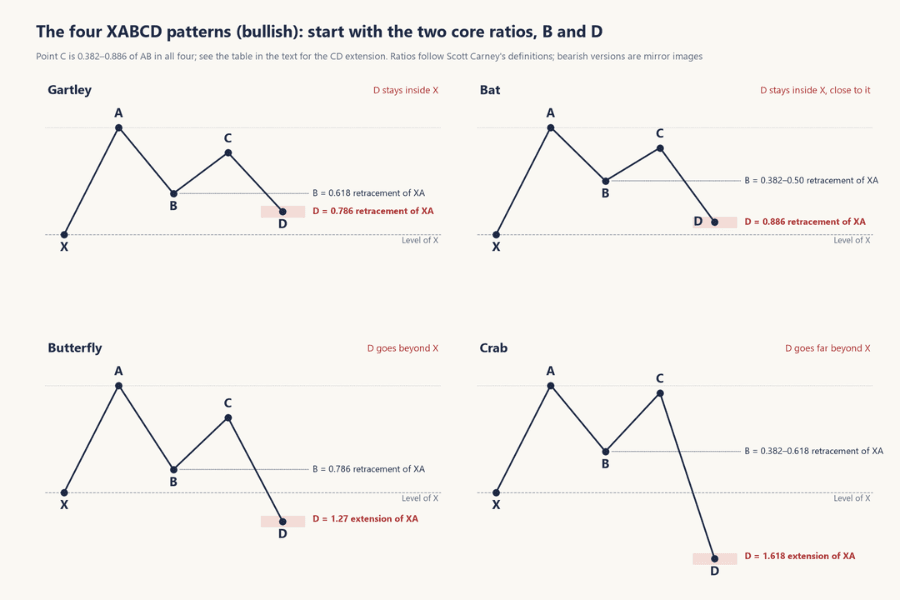
Two core numbers give you a first read on which of the four you are looking at: how deep B retraces XA, and which ratio of XA D lands on. Point C and the CD extension come in when you confirm the structure against the table.
Start with the overview chart and the ratio table, then go through the identification points for each. All four are described in their bullish form; the bearish versions use the same ratios in the opposite direction.
| Pattern | B retracement of XA | C retracement of AB | D relative to XA | CD relative to BC | Position of D |
|---|---|---|---|---|---|
| Gartley | 0.618 | 0.382–0.886 | 0.786 retracement | 1.13–1.618 | Inside X |
| Bat | 0.382–0.5 | 0.382–0.886 | 0.886 retracement | 1.618–2.618 | Inside X, close to X |
| Butterfly | 0.786 | 0.382–0.886 | 1.27 extension (some definitions accept up to 1.618) | 1.618–2.24 | Beyond X |
| Crab | 0.382–0.618 | 0.382–0.886 | 1.618 extension | 2.24–3.618 | Well beyond X |
| AB=CD | — | 0.618 or 0.786 | — | 1.272 or 1.618 | Depends on the length of CD |
The ranges in the table follow Scott Carney's definitions. Other sources differ slightly at the edges — some start the Gartley's CD extension at 1.27, some start the Crab at 2.618 — but the core B and D ratios are the same everywhere.
-
Gartley: the quick check is B = 0.618 of XA and D = 0.786 of XA. D does not break X; the pattern completes inside the XA range as a retracement. C retraces 0.382 to 0.886 of AB, and the CD extension of BC confirms the PRZ.
-
Bat: the quick check is a shallow B (0.382 to 0.5 of XA) and a deep D (0.886 of XA). D is again inside X but closer to it, and CD's extension of BC is larger than in the Gartley.
-
Butterfly: the quick check is B = 0.786 of XA, with D most typically completing at the 1.27 extension of XA; some definitions accept up to 1.618. D breaks through X, so this is an extension-type reversal structure: look for the PRZ near the new low or high, and X is not the invalidation level.
-
Crab: the quick check is B between 0.382 and 0.618 of XA and D completing at the 1.618 extension of XA. It has the deepest D extension of the four, and its PRZ sits farthest from X.
-
AB=CD: only four points. C retraces 0.618 or 0.786 of AB, CD runs 1.272 or 1.618 times BC, and in the ideal case CD equals AB in length. It is the most basic symmetrical projection and one of the references most XABCD patterns use to project D.
Two other common variants are the Shark and the Cypher. In both, C goes beyond A, so the structure differs from the four above and each has its own ratio set. Beginners are better off getting fluent in the four basic patterns before moving on to these.
4. How to Draw Harmonic Patterns: Finding X, A, B, C and D with Fibonacci Tools
Identify from left to right, one leg at a time. As soon as a leg fails its ratio, drop the pattern — never shift a turning point to make the numbers fit.
MT4 and MT5 have no built-in XABCD tool, but measuring by hand with the built-in Fibonacci Retracement and Fibonacci Expansion tools is all you need. For how to draw both tools, and for Titan FX's indicator that draws retracements automatically (Titan_auto_fibonacci), see the drawing section of the Fibonacci guide. The steps are as follows.
-
Step 1: Find XA: pick a clear impulse leg on the chart, with both the start X and the end A at unmistakable turning points. Any timeframe works, but H4 and daily turning points are less prone to noise.
-
Step 2: Measure B: draw a Fibonacci retracement from X to A and see which line B lands on. Near 0.618 is a Gartley candidate, 0.382 to 0.5 a Bat, and near 0.786 the core B condition of a Butterfly. How much deviation you accept depends on your tolerance rule.
-
Step 3: Measure C: draw a retracement from A to B; C should land between 0.382 and 0.886. If C goes beyond A, it is none of the five patterns covered here.
-
Step 4: Calculate the reversal zone for D: draw a Fibonacci expansion from B to C and take the multiple the pattern calls for. Then check against XA whether D should land on the 0.786 or 0.886 retracement or the 1.27 or 1.618 extension. A proper PRZ exists only when the XA ratio, the BC extension and the AB=CD projection cluster around similar prices.
-
Step 5: Wait for price to enter the zone: until price reaches D, the pattern is only "potential." Even once price is inside the PRZ, you still have to see whether the reversal actually happens.
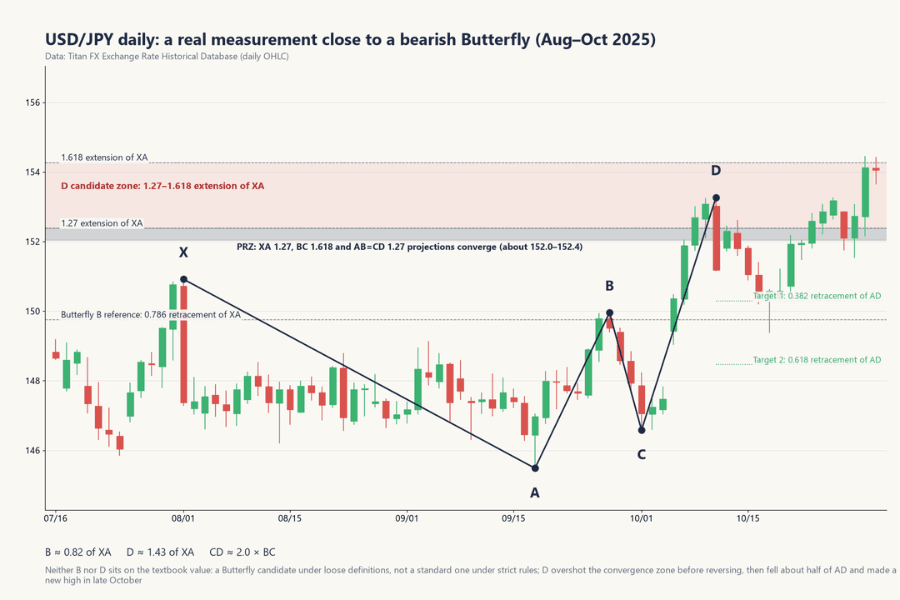
The chart below is a real case found in the daily data of Titan FX's Exchange Rate Historical Database. Between August and October 2025, USD/JPY formed an XABCD structure close to a bearish Butterfly.
B retraced about 0.82 of XA, near the 0.786 reference the Butterfly uses; CD ran about 2.0 times BC; and D extended to about 1.43 times XA.
With a 1.27–1.618 completion zone and some tolerance, it qualifies as a Butterfly candidate; under a strict definition built on B = 0.786 and D = 1.27 XA, it is not a textbook Butterfly. This is the situation you meet most often when measuring: the real move looks right, but the ratios are not the perfect textbook values.
The other thing to notice is where the PRZ sits. The 1.27 extension of XA, the 1.618 extension of BC and the 1.27 AB=CD projection converged at 152.0–152.4, yet price pushed through that zone and did not reverse until 153.3.
It then gave back half of AD within 15 trading days and made a new high in late October. Waiting for confirmation and keeping the stop outside the candidate zone exists precisely for cases like this.
Ratio tolerance is the most common practical problem. Textbook ratios are exact values, but real moves rarely land exactly on 0.618, so a few percentage points of deviation are normally allowed. Be stricter with D than with B, because D is the basis for the entry.
There is no universal tolerance, and most auto-scanning indicators leave the setting to the user. Keep the same tolerance rule for the same strategy; otherwise it is too easy to adjust the standard after seeing the result. Some traders screen with the whole-number Fibonacci lines only (0.382, 0.5, 0.618, 0.786) and measure precisely just the candidates that pass.
5. How to Trade Harmonic Patterns: Entry, Stop-Loss and Targets
The advantage of harmonic patterns is that the entry, stop-loss and targets can all be calculated before the pattern completes. Trade them in this order.
-
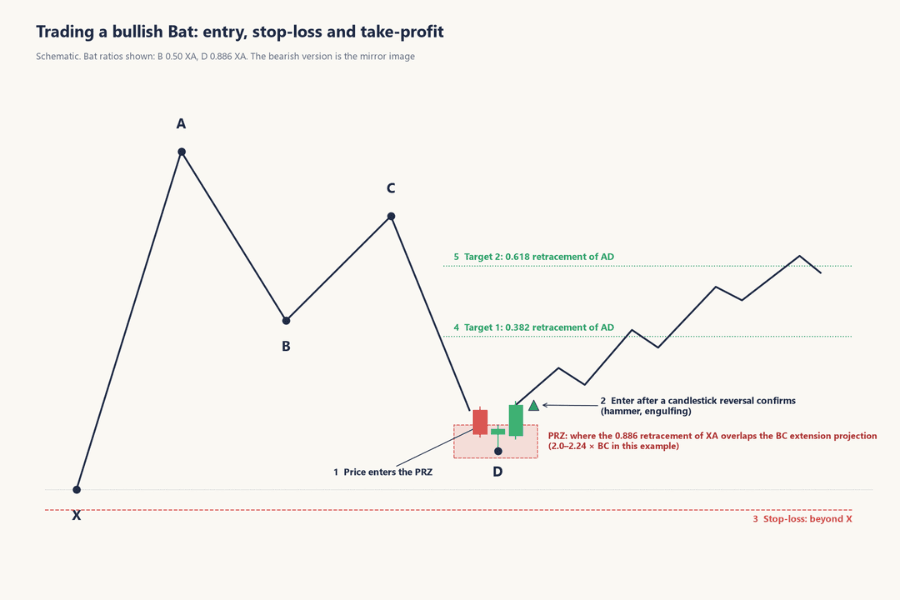
Entry: once price enters the PRZ, wait for confirmation of the reversal before entering. Common confirmations are a candlestick reversal signal (hammer, engulfing), RSI divergence, or an overlap between the PRZ and existing support and resistance. Some traders place a limit order at D instead, which skips the check on whether price has actually started to reverse and takes on the risk of pattern failure more directly.
-
Stop-loss: outside the PRZ. In the Gartley and Bat, D is inside X, so beyond X is the obvious invalidation area and the stop usually goes there. In the Butterfly and Crab, D is already beyond X, so the stop goes outside the PRZ and D, at a distance set by the pattern's invalidation rule, recent structure or a multiple of ATR.
-
Targets: a common scaling-out approach uses the 0.382 retracement of AD as the first target and the 0.618 as the second. Others use C, A or the next support or resistance ahead; exit rules differ from one harmonic trading system to another. Scaling out lets you take part of the position at the first target and move the stop to breakeven on the rest.
-
Risk-reward: with the entry, stop and first target all known, the risk-reward ratio can be worked out before entering; check that it clears your strategy's threshold. When the stop is far from the PRZ and the first target is close, even a well-proportioned pattern may not qualify. Position size is then back-calculated from the stop distance with the position sizing formula.
Harmonic patterns and Elliott Wave both use Fibonacci ratios, so some traders use the wave structure as the big-picture backdrop and harmonic patterns to pinpoint the reversal zone. The two methods define their patterns differently, though, and an XABCD cannot simply be mapped onto a fixed set of waves; when combining them, let each method's own rules govern.
| Item | Gartley, Bat | Butterfly, Crab |
|---|---|---|
| Position of D | Inside X | Beyond X |
| Entry | Reversal confirmation inside the PRZ | Reversal confirmation inside the PRZ |
| Stop-loss | Beyond X | Outside the PRZ and D, by invalidation rule or a multiple of ATR |
| First target | 0.382 retracement of AD | 0.382 retracement of AD |
| Second target | 0.618 retracement of AD, or C | 0.618 retracement of AD, or C |
6. Limits of Harmonic Patterns and Common Mistakes
-
Choosing turning points is subjective: on the same move, a different X or A gives different ratios. Two traders drawing two different patterns is common. The fix is to use only clear swing highs and lows, never the noise of a smaller timeframe.
-
There is no correct tolerance: set it too wide and almost any move becomes a pattern; set it too tight and hardly anything qualifies. Backtest on historical charts with a fixed tolerance first and find the range you can live with.
-
Completion is not reversal: the PRZ is only an area where a reversal is more likely, and in a strong trend price goes straight through it. Entering without confirmation is the most common source of losses in harmonic trading.
-
Stops can be wide: in the Butterfly and Crab, D sits at an extension, and a stop beyond the next ratio is a long way off. Reduce the position size accordingly or a single loss will exceed your budget.
-
Overfitting: spotting a likely-looking structure and then hunting for ratios that fit it gets cause and effect backwards. The right order is to measure B, then C, then calculate D, and to drop the pattern as soon as any leg fails.
-
Ignoring the context: in the Gartley and Bat, D lies within the XA range, so structurally they are deep pullbacks within the prevailing trend. In the Butterfly and Crab, D goes beyond X: they look for a reversal after an overextension. The two groups appear in different places, so first decide whether you are mid-trend or at its end.
7. Harmonic Patterns FAQ
Q1: How do harmonic patterns differ from ordinary chart patterns?
Ordinary chart patterns are judged by shape and neckline; harmonic patterns are measured with Fibonacci ratios, and each leg has a numerical condition. The advantage is that the reversal zone can be calculated in advance; the drawbacks are a more laborious identification process and having to decide your own ratio tolerance.
Q2: How do I quickly tell the Gartley, Bat, Butterfly and Crab apart?
First check whether D is inside X. Inside X are the Gartley (D at the 0.786 retracement of XA) and the Bat (0.886); beyond X are the Butterfly (1.27 extension, up to 1.618 in some definitions) and the Crab (1.618).
Then check B: 0.618 for the Gartley, 0.382 to 0.5 for the Bat, 0.786 for the Butterfly, and 0.382 to 0.618 for the Crab.
Q3: Which harmonic pattern is the most reliable?
There is no accepted answer. The Bat's D sits at 0.886 of XA, close to X, so some trading rules can set a tighter invalidation level; the Crab's D sits at 1.618 of XA, a much deeper completion. Which one actually performs better depends on the instrument, timeframe, tolerance and entry and exit rules, so you have to backtest it yourself.
Your own trading records are more reliable than someone else's statistics.
Q4: Can MT4 or MT5 draw harmonic patterns automatically?
MT4 and MT5 have no built-in XABCD drawing tool, so you measure by hand with the Fibonacci Retracement and Fibonacci Expansion tools. Third-party indicators and EAs can scan automatically, but their identification rules and tolerances vary, so check the ratio settings before relying on one.
Q5: Which timeframe suits harmonic patterns?
Any timeframe can be used. H4 and daily turning points are clearer and less noisy, so patterns there tend to be more reliable; shorter timeframes complete faster but produce more false signals. If you are just starting to practice, look for patterns on the daily or H4 chart first.
8. Conclusion
Harmonic patterns are five-point XABCD structures defined by Fibonacci ratios. The Gartley, Bat, Butterfly and Crab differ in how deep B retraces and where D sits relative to XA, and the AB=CD is the base most patterns use to project D. The Potential Reversal Zone (PRZ), where several projections overlap, is the reference for planning the entry and the stop.
In trading, measure from left to right and drop the pattern as soon as a leg fails. Once price enters the PRZ, wait for confirmation from candlesticks, RSI or support and resistance before entering, place the stop outside the PRZ, and take profit at the 0.382 and 0.618 retracements of AD.
The subjectivity and the tolerance problem cannot be removed entirely. Backtesting with fixed rules and confirming with other tools is what makes harmonic patterns usable with any consistency.
Further Reading
- Double Top and Bottom Patterns: Features and Strategies
- Head and Shoulders Top and Bottom: Structure, Measuring Rule, and Trading Strategies
- Trendlines: How to Draw Them, Judge Validity, and Confirm Breakouts
- False Breakout: How to Spot It, Filter It, and Trade the Failure
- How to Set a Stop Loss? 5 Common Methods Compared
Titan FX Research Team. We cover a broad set of financial instruments — foreign exchange, commodities (crude oil, precious metals, agricultural products), equity indices, US equities, and digital assets — producing practical, research-backed educational content for traders.
Primary Sources (by Category)
- Technical analysis classics: H.M. Gartley, Profits in the Stock Market (1935) — the original description of the Gartley pattern; Larry Pesavento, Fibonacci Ratios with Pattern Recognition (1997) — combining Fibonacci ratios with pattern recognition; Scott M. Carney, the Harmonic Trading series — ratio definitions for the Bat, Crab and other patterns and the concept of the Potential Reversal Zone
- Platforms and tools: MetaQuotes MT4/MT5 documentation — drawing the Fibonacci Retracement and Expansion tools; Titan FX Research — Exchange Rate Historical Database, USD/JPY daily OHLC for August to October 2025 (data for the example chart in Section 4)