Candlestick Charts

How to Read Candlestick Charts: A Comprehensive Guide to 20 Candlestick Patterns and Market Predictions
This article introduces 20 common candlestick patterns, such as Bullish Engulfing and Morning Star, widely applied in forex, stock, and other markets. These patterns help traders analyze market sentiment and trends for informed decision-making.
Advantages and Disadvantages of Candlestick Charts: Purpose and Importance of Learning Candlesticks
Candlestick charts, widely used in trading, offer both benefits and limitations. This article explores their advantages, disadvantages, and why understanding candlestick patterns is vital for traders in forex, stocks, and other financial markets.
Price Gaps: Types, Causes, and How to Analyze and Trade Them
A "Gap" or "Price Gap" refers to a noticeable blank space on a candlestick chart where no trading activity occurs. According to technical analysis, gaps are categorized into four types: 1) Common Gap, 2) Breakaway Gap, 3) Runaway Gap, and 4) Exhaustion Gap.

Three Methods:Rising &Falling Patterns in Candlestick Charts
The Rising Three Methods and Falling Three Methods are crucial candlestick chart patterns that indicate trend continuation in financial markets. This article explores their structure, market implications, and how to use them for effective trading analysis.
Three Gaps Pattern: Upward and Downward Three Gaps
The Three Gaps pattern, from Sakata's Five Methods, is a key tool for predicting market reversals. This article explores the Upward Three Gaps and Downward Three Gaps patterns, helping traders identify potential trend changes in the market.

Three Rivers Pattern:Morning Star and Evening Star in Market
Explore the Three Rivers pattern, including the Morning Star and Evening Star, to identify key market reversal signals. This guide helps traders understand its application in market analysis.

Three Mountains: Triple Top and Bottom Reversal Patterns
The "Three Mountains" pattern is a key part of the Sakata Five Methods, signaling potential trend reversals. This article explains the pattern’s definition, characteristics, and how it is applied in modern financial markets.

Three White Soldiers &Three Black Crows Candlestick Patterns
Learn about the Three White Soldiers and Three Black Crows candlestick patterns. Understand their market signals and how to use them for trading strategies in Forex and stocks.
Bullish Candlestick Patterns in Forex and Stock Trading
Learn about four key bullish continuation candlestick patterns: Slow Uptrend, Bullish Vanguard, Three White Soldiers, and High Price Side-by-Side Candlesticks. These patterns help identify price movements in an uptrend and predict further upward movement or potential pullbacks.
Bullish Reversal Candlestick Patterns in Trading
Explore four key bottom reversal candlestick patterns—Hammer, Inverted Hammer, Bullish Engulfing, and Morning Star—commonly used in trading to identify potential price reversals and trend changes.
Top Reversal Candlestick Patterns in Forex and Stock Trading
Learn about four key top reversal candlestick patterns—Bearish Engulfing, Dark Cloud Cover, Shooting Star, and Evening Star—that help traders identify potential price declines and trend reversals in forex and stock markets.

Bearish Candlestick Patterns:Hanging Man & Three Black Crows
Learn how the Hanging Man and Three Black Crows candlestick patterns signal trend reversals in the forex market. Master these indicators to improve trading strategies.

Wedge Patterns: Features, Analysis Methods,and Strategies
Learn about wedge patterns in trading, including rising and falling wedges. Understand their structure, types, and how to use them in trend reversal and continuation strategies for more accurate market predictions.

Triangle Patterns: Features, Analysis Methods,and Strategies
Explore the three main types of triangle patterns—ascending, descending, and symmetrical. Learn how to identify these patterns, their market implications, and strategies for trading them effectively.
Flag Patterns: Features, Analysis Methods and Strategies
Flag patterns are key consolidation patterns in forex and stock trading. This article explores their structure, types, and practical applications to help traders make informed decisions.

Box Theory: Box Patterns, Drawing Methods, and Strategies
Box Theory is a popular technical analysis method used to predict price movement based on the formation of "box" patterns. This article explains how to identify box patterns, draw them, and apply effective trading strategies for both upward and downward breakouts.
Continuation Patterns: Features and Strategies
This article explores four major continuation patterns—Wedge, Flag, Triangle, and Box—highlighting their features, formation conditions, and how they apply in real trading.

Double Top and Bottom Patterns: Features and Strategies
This article provides an in-depth analysis of Double Top and Double Bottom patterns, revealing their importance in technical analysis and how traders can apply this knowledge to capture potential entry and exit opportunities.
V-shaped and Inverted V Patterns: Features and Strategies
V-shaped and inverted V-shaped patterns are key indicators in technical analysis, predicting trend reversals. This article covers their features, identification, and trading strategies to help traders make informed decisions.
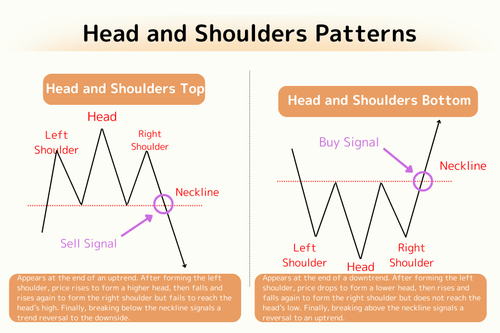
Head and Shoulders Top and Bottom: Structure, Measuring Rule, and Trading Strategies
The Head and Shoulders pattern—both top and bottom—remains the single most reliable reversal formation since Edwards & Magee's 1948 Technical Analysis of Stock Trends. This guide covers the four components (shoulders, head, neckline), volume staircase, breakout confirmation, measuring rule, fakeout filtering, multi-indicator confluence, and historical cases from Dow 1929, Nikkei 1989, Nasdaq 2000, the 2008 GFC, Tesla 2022, and Bitcoin 2018.