

What Is Currency Depreciation? Why Currencies Fall, the Effects and How to Measure It
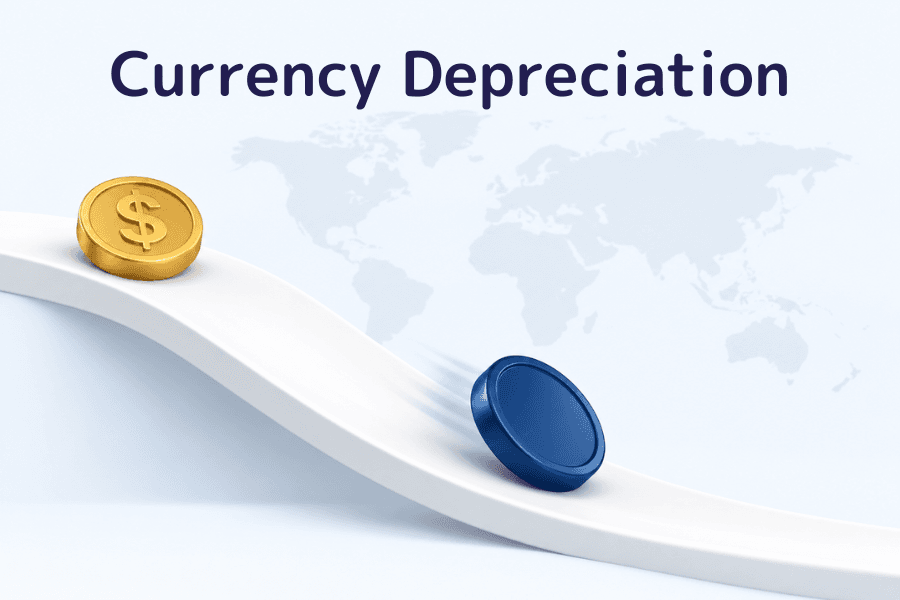
If USD/JPY rises from 150 to 160, one dollar buys more yen than before. The yen has depreciated against the dollar.
In everyday use, a currency "losing value" can mean three different things: an outcome produced by the market, an official decision to lower a fixed rate, or the erosion of purchasing power when prices rise. The causes and the way each one unfolds are different, so treating them as one topic leads to the wrong conclusions.
This article separates the three meanings, then covers the benchmarks you need before quoting a percentage, the four common routes through which depreciation happens, what counts as disorderly, and finally who gains, who pays, and what traders run into.
- Depreciation happens in the market; devaluation is an official decision under a fixed or pegged regime
- A single currency pair cannot tell you whether a currency is broadly weak; the trade-weighted effective exchange rate can
- Change the start date and the same currency can be described as down 8 percent or up 3 percent
- Whether a move is disorderly depends on speed, volatility, liquidity and the policy response, not on the cumulative fall alone
- Price direction and swap points have to be worked out separately
- 1. What Is Currency Depreciation? Market Moves, Official Devaluation and Purchasing Power
- 2. How to Measure a Fall: Fix the Benchmark and the Start Date First
- 3. Why Do Currencies Depreciate? Four Common Routes
- 4. What Is a Disorderly Fall? Speed, Volatility and the Policy Response
- 5. What Are the Effects? Exports, Imports, Inflation and Foreign Currency Debt
- 6. How Traders Handle It: Price Direction, Swap Points and Intervention Risk
- 7. FAQ
- 8. Summary
1. What Is Currency Depreciation? Market Moves, Official Devaluation and Purchasing Power
Depreciation and devaluation are often used interchangeably, but they describe different events, and what separates them is the exchange rate regime behind the move.
Depreciation is a fall driven by supply and demand under a floating exchange rate. Nothing is announced; the rate simply moves lower. Almost every decline in a major currency belongs here.
Devaluation is an official decision to lower the stated value or parity of a currency. It happens under fixed or pegged regimes, and it comes with a specific date and a specific size. The parity adjustments of the Bretton Woods system are the classic example.
A loss of purchasing power is a third and looser meaning. When prices rise and the same money buys less, people say their currency is losing value. That belongs to inflation and real purchasing power rather than to the currency market.
| Term | Measured against | Main mechanism |
|---|---|---|
| Depreciation | Other currencies | Market exchange rate moves |
| Devaluation | An official rate or peg | Authorities adjust the parity or the regime |
| Loss of purchasing power | Goods and services | Domestic prices rise |
Managed floats sit between the two. The onshore renminbi (CNY) has a daily reference rate and a trading band, and while supply and demand still move the rate, the reference rate and official operations matter as well. The offshore renminbi (CNH) trades outside the mainland, its price forms differently, and the two can diverge.
Which side of a pair is falling is a question about the direction of the quote, covered in the article on base and quote currency.
2. How to Measure a Fall: Fix the Benchmark and the Start Date First
"The currency is down 10 percent" is incomplete. Two things are missing: against what, and from when.
Against what
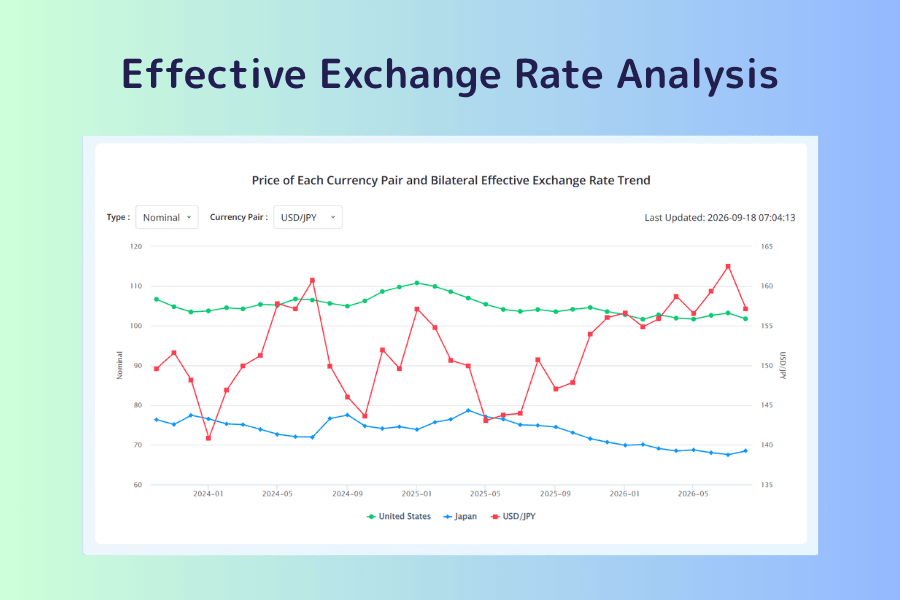
A single exchange rate only describes the relationship between two currencies. The yen can be weakening against the dollar while it holds steady against the euro and gains against some emerging market currencies. Reading USD/JPY alone and concluding that "the yen is falling" describes the yen against the dollar and nothing more; a complete statement names the currency on the other side.
To look at a currency as a whole, use the effective exchange rate. It combines a currency's bilateral rates against its main trading partners, weighted by trade. The nominal effective exchange rate (NEER) covers the rates themselves, and the real effective exchange rate (REER) adds the difference in prices or costs between the economies.
From when
The start date changes the answer. Measured from the start of the year a currency might be down 8 percent; measured from a low six months ago the same currency is up 3 percent. Both numbers are correct, and the only difference is where the measurement begins.
When you see a figure for how far something has fallen, ask what date it starts from. To check it yourself, the Exchange Rate Historical Database holds daily history, so you can pick your own starting point and run the numbers again.
A related question is whether a currency is currently cheap or expensive. Purchasing power parity offers a long-run benchmark rather than a short-term signal. A rate can sit far from PPP for a long time without returning.
3. Why Do Currencies Depreciate? Four Common Routes
Exchange rates are made by buying and selling. A currency falls because more people are selling it than buying it. The four routes below describe the situations that push people to sell.
| Route | Who is selling the domestic currency | What to watch |
|---|---|---|
| Interest rates | Money moving abroad in search of higher yield | Policy rates and market expectations for the path ahead |
| Inflation | Consumers and firms switching to imports | The inflation gap against major trading partners |
| Trade | Companies paying for imports | The trade balance, energy and commodity prices |
| Capital flows | Foreign investors leaving domestic stocks and bonds | Volatility and the behavior of safe-haven currencies |
Several routes usually operate at once. Identifying which one is leading is what tells you how long the move is likely to last.
The interest rate route
Suppose the domestic rate is 1 percent and the foreign rate is 4 percent. The same money earns 3 percent more abroad. Collecting that yield means converting domestic currency into foreign currency first, and that conversion is itself a sale of the domestic currency. As those flows accumulate, the currency comes under pressure.
What the market trades is the expected path of rates rather than the policy rate already announced. Expectations of a turn usually show up in the exchange rate before the decision itself.
The inflation route
Suppose domestic prices rise 8 percent in a year while a trading partner sees 2 percent. Domestic goods become relatively expensive and imports relatively cheap. As spending and procurement shift toward imports, buyers need foreign currency to pay, and demand at the exchange window tilts toward selling the domestic currency.
This route works slowly, and short-term rates still respond to interest rates, capital movements and policy expectations. High inflation does not mean a currency falls immediately.
The trade route
Importers convert domestic currency into foreign currency before they pay, and exporters convert foreign receipts back. The first is a sale of the domestic currency and the second a purchase; the net of the two sets the direction.
When oil prices jump in an energy-importing economy, more foreign currency is needed to settle those invoices and the selling side gets heavier. Trade in goods is only part of the picture, though: cross-border investment is often larger and can run the other way.
The capital flow route
Foreign investors hold domestic stocks and bonds. When risk appetite turns, they sell those assets first and then convert the proceeds back into their own currency, and that last step is the sale of the domestic currency.
The selling concentrates into a short window while money moves toward safe-haven currencies. These moves usually come with rising volatility, and how long they last depends on the event itself and on where money goes next.
Working out which route is leading
All four end in the same place: cross-border money changes supply and demand in the currency market. The article on capital flows walks through the full chain, including the sudden stop, which is the most violent version of it.
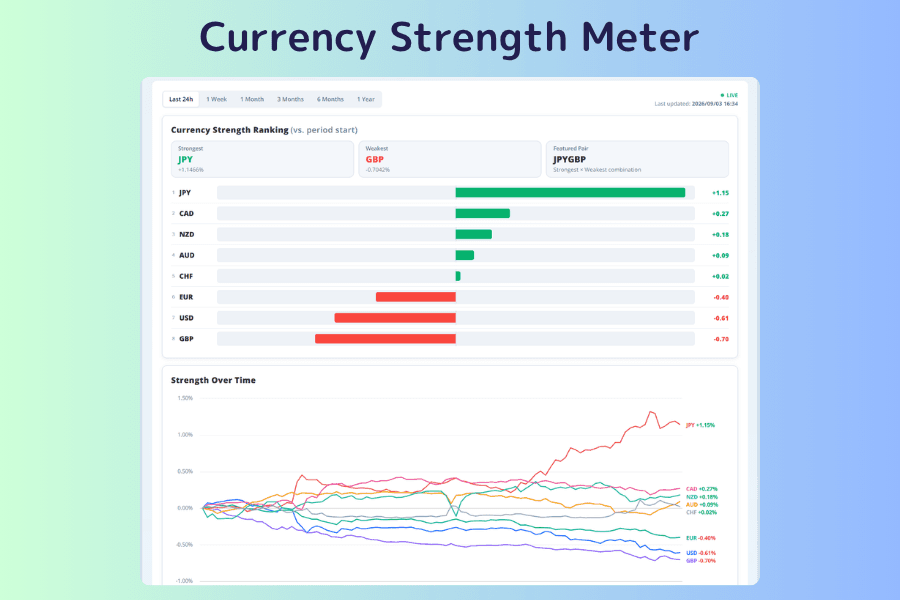
One simple check is whether the move is happening to this currency alone. If the dollar is strengthening against several major currencies at once, broad dollar strength is the more likely explanation. If the move is concentrated in one pair, it is worth looking at the other side for something specific to it. The Currency Strength Meter ranks the major currencies side by side.
4. What Is a Disorderly Fall? Speed, Volatility and the Policy Response
A disorderly fall is one that runs in a single direction within a short period while liquidity deteriorates and the market cannot absorb it.
Depreciation itself is not a problem. Export-led economies go through mild depreciation regularly as the cycle turns. Telling the two apart takes more than the cumulative decline.
-
Speed: a range that normally takes months is covered in days, leaving no time to adjust positions.
-
Volatility and liquidity: volatility jumps, the rate swings hard in both directions intraday, and spreads widen with it.
-
The rate response: a central bank may raise rates to make domestic assets more attractive, or to ease outflows and pressure on the currency. Whether it does so still depends on inflation, growth and financial stability.
-
Reserves: when foreign exchange reserves drop sharply over a short period, check whether intervention, valuation changes or government spending in foreign currency explains it.
-
Policy steps: verbal warnings escalate into actual intervention, and in some cases into discussion of capital controls.
Most examples come from emerging markets, and the Turkish lira is the one most often cited in recent years. What these episodes share is that the fall itself invites more selling, creating a self-reinforcing loop that tends to persist until policy turns decisively.
Major currencies can reach the point where authorities step in as well. Intervention against a falling currency means selling foreign currency and buying the domestic one. The article on FX intervention sets out the types of intervention and how markets respond, and for anyone holding a position in the direction of the fall, this is the risk that matters most.
5. What Are the Effects? Exports, Imports, Inflation and Foreign Currency Debt
Depreciation is not simply good or bad. It moves value from one group to another.
Who may gain
-
Exporters: where revenue is mostly in foreign currency and costs are mostly domestic, converted revenue can rise and prices abroad can become more competitive. The real effect depends on how products are priced, how much of the input is imported, and what hedging is in place.
-
Tourism and services exports: the country becomes cheaper for visitors from abroad.
-
Holders of foreign currency assets: overseas deposits, equities and bonds are worth more once converted back.
-
Households receiving remittances: the same amount of foreign currency converts into more domestic currency.
Who may carry the cost
-
Importers and manufacturers reliant on imported inputs: costs in domestic currency rise, and whether they can be passed on depends on pricing power.
-
Consumers: imported goods, energy and raw materials cost more in domestic currency, which becomes imported inflation. How much reaches the shelf depends on corporate pricing, the share of imports, demand conditions and monetary policy.
-
Anyone traveling, studying abroad or spending in foreign currency: the bill in domestic currency goes up.
-
Companies borrowing in foreign currency: the domestic currency value of the debt grows, and so does the burden of servicing it.
The net effect on an economy depends on its export structure, import dependence, foreign currency debt, corporate pricing power, hedging and domestic demand. The same percentage fall can mean very different things for growth, corporate earnings and prices in two different economies, which is why the same event draws opposite commentary in different markets.
6. How Traders Handle It: Price Direction, Swap Points and Intervention Risk
Price direction and swap points are separate calculations
Being convinced that a currency will keep falling tells you nothing about whether swap points will be credited or charged.
Swap depends on which pair you trade, which direction you take, the interest rates on both sides and the swap settings at the time, and it changes with market conditions.
A short position in a low-yielding currency can earn a credit, which is the basic structure of a carry trade; the opposite combination pays. The longer the holding period, the more the price move and the carrying cost have to be counted together.
Intervention risk is asymmetric
Intervention against a falling currency usually arrives after a one-way move has already run for some time. The timing cannot be predicted, and the size can erase weeks of gains in a very short window.
Watch for changes in tone on Central Bank Watch, and place a stop-loss where an unexpected move is still survivable.
Wider ranges change position size
In a disorderly phase the intraday range can be several times its usual width, which lengthens the distance to a sensible stop.
Keeping the same risk per trade means cutting the lot size as that distance grows. With the same leverage setting, entering with your usual size no longer carries your usual risk.
7. FAQ
Q1: If one currency depreciates, does the other always appreciate?
Within the same pair, yes. USD/JPY rising means the dollar has gained against the yen and the yen has lost against the dollar; both describe one event.
Across a currency as a whole, not necessarily. The yen can fall against the dollar while holding steady or gaining against others, and the overall direction shows up in the effective exchange rate.
Q2: Do countries deliberately weaken their own currencies?
Yes, and there are historical examples. The usual motives are improving export competitiveness or reducing the burden of debt denominated in the domestic currency.
How far a government can go depends on the exchange rate regime. Under a fixed or pegged regime, the parity or target can be moved directly. Under a float, authorities do not normally set the daily trading price and work instead through monetary policy, intervention and communication.
The costs are equally clear: imports and energy become more expensive, foreign currency debt grows in domestic terms, and trading partners may respond in kind. The Plaza Accord is the rare coordinated version, with several countries agreeing to push the dollar lower.
Q3: Does depreciation always cause inflation?
No. Exchange rate pass-through to consumer prices varies widely between economies and depends on the share of imports in consumption, how much cost firms can absorb, and the strength of domestic demand. Pass-through tends to be limited where imports are a small share of spending.
Q4: Why does the figure in the news not match the rate I see?
The benchmark is usually different. The figure may come from an effective exchange rate rather than a single pair, or it may start from a different date. Check both before comparing.
Q5: Is a depreciating currency worth holding for the long term?
It depends on whether the interest earned outweighs the currency loss. The fall by itself is neither a reason to hold nor a reason to avoid.
The return on holding a currency has two parts, interest and the exchange rate move. High rates often appear on currencies under pressure, and only the two together show whether the net result is positive.
Q6: How can I tell what stage a depreciation has reached?
No single indicator settles it. Look at the level of the effective exchange rate, volatility, rate expectations, capital flows and the official stance together, then check whether the conditions that caused the fall are still in place.
8. Summary
A currency losing value can mean a market-driven fall, an official devaluation or a loss of purchasing power. Separating them determines which data you need.
For size, a single pair answers only part of the question and the trade-weighted effective exchange rate describes the whole, with a start date you have confirmed yourself. For cause, work through the interest rate, inflation, trade and capital flow routes, identify which one is leading, and then watch whether that condition changes.
For traders, the parts most often overlooked are that swap points need their own calculation, that intervention carries timing risk, and that position size has to be recalculated once ranges widen.
Further Reading
- Forex Glossary & Beginner's Guide: Terms Every Trader Should Know
- Forex Fundamental Analysis: Concepts, Objectives, Influencing Factors and Methods
- Why Invest in the US Dollar: DXY, Fed Policy and Allocation Strategy
- What Is Currency Correlation? Patterns, Risk and Titan FX Tools
The financial market research team at Titan FX. We produce educational content for investors across foreign exchange, commodities (crude oil, precious metals, agricultural products), stock indices, US equities and digital assets.
Primary Sources (by Category)
- Frameworks and definitions: International Monetary Fund (IMF) exchange rate regime classifications and research on exchange rate pass-through; Bank for International Settlements (BIS) effective exchange rate statistics and methodology
- Market data: Titan FX Research Effective Exchange Rate Analysis, Currency Strength Meter, Exchange Rate Historical Database, Swap Point Calendar
- Policy information: Central bank announcements and policy statements